



Cosmos (ATOM) trades near $1.62 on October 25, 2026, after a sharp 8.76% selloff on October 24 pushed it below every major moving average. Our Cosmos price prediction 2026 2030 puts the realistic path in three bands, not one magic number.
The base case sees ATOM rebuilding slowly to about $2.10 to $3.40 by 2030. The bear case keeps it near $1.20 to $2.10, and the bull case needs real ecosystem demand to reach $3.40 to $5.00.

Nobody can promise any of these outcomes, and this article explains what would have to happen for each one.
- Key takeaways
- ATOM price today: what $1.62 really means
- Why analysts disagree so much about ATOM
- Our scenario bands for 2026 to 2030
- What could actually move ATOM
- How to read this prediction without getting burned
- FAQs
- What is the Cosmos price prediction 2026 2030 in simple terms?
- Will ATOM reach $10 by 2030?
- Is ATOM a good investment in 2026?
- What is the lowest ATOM could fall to?
- What drives the Cosmos price most?
- Bottom line
Key takeaways
- ATOM trades near $1.62 on October 25, 2026, with a market cap near $872 million.
- ATOM sits about 96% below its September 2021 high of $43.84.
- Current analyst forecasts for 2030 cluster near $2.80 to $3.38, far below old $50 and $300 calls.
- Our base case for 2030 is $2.10 to $3.40, our bear case is $1.20 to $2.10, and our bull case is $3.40 to $5.00.
- October 2026 brought real Hub news, but none of it guarantees a price rise.
ATOM price today: what $1.62 really means
Price trackers on October 25, 2026, put ATOM between $1.62 and $1.65. The 24 hour range ran roughly from $1.61 to $1.67, and the market cap sat near $872 million.
These numbers move every hour, so treat them as a snapshot, not a fixed price.
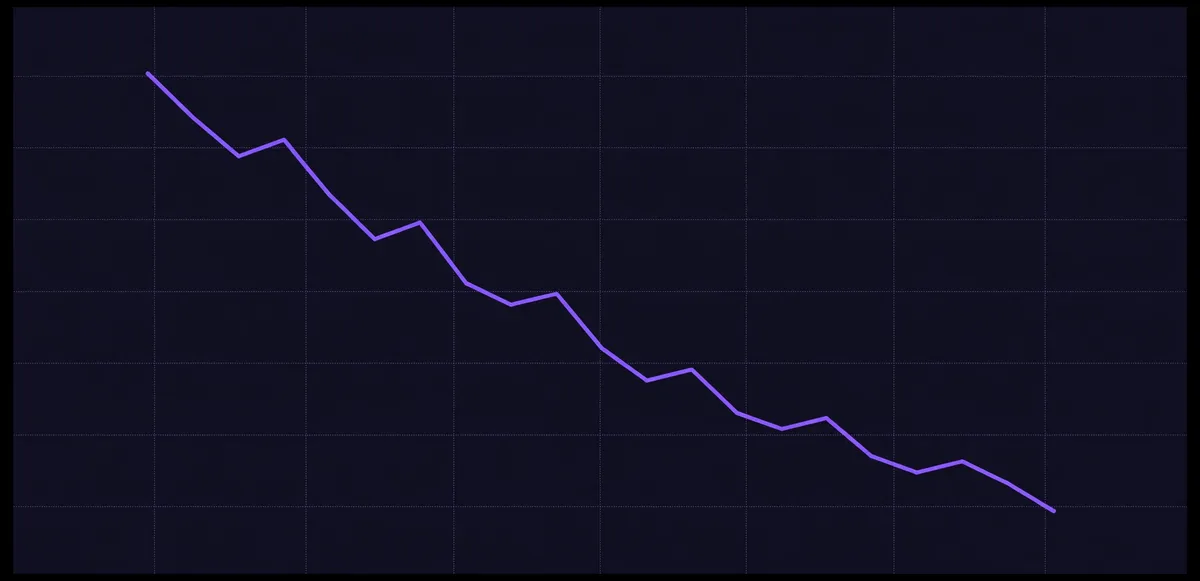
The October 24 selloff matters more than the exact cent level. ATOM fell 8.76% in one session to about $1.66, and that drop pushed it below its 7 day, 20 day, 50 day, and 200 day averages at the same time.
Traders read that pattern as weakness, because buyers from every recent time window now sit underwater on average.

The longer history gives the drop context. InsideBitcoins reported ATOM at $1.67 on October 24, down 4.3% over seven days and down 47.6% over one year.
The same report put circulating supply at 537.9 million ATOM and the 52 week range between $1.22 and $3.24. ATOM has not traded anywhere near its old high for years, and any honest forecast must start from that fact.
| ATOM snapshot | Value | Source date |
|---|---|---|
| Price | About $1.62 | October 25, 2026 |
| 24 hour range | $1.61 to $1.67 | October 25, 2026 |
| Market cap | About $872 million | October 25, 2026 |
| Circulating supply | About 537.9 million ATOM | October 24, 2026 |
| 52 week range | $1.22 to $3.24 | October 2026 |
| All time high | $43.84 in September 2021 | September 2021 |
Why analysts disagree so much about ATOM
Search for a Cosmos price prediction and you will find forecasts that differ by 100 times. Some pages still show $50, $150, or even $300 for 2030, while current algorithmic models show under $1.
That gap confuses readers, and it has a simple cause: old forecasts assumed a different market.
Many high forecasts came from articles written when ATOM traded far higher and when analysts assumed Cosmos would capture a huge share of all cross chain activity. Those assumptions did not play out.
ATOM fell, other ecosystems grew, and the Cosmos Hub itself changed strategy, so forecasts built on the old story no longer fit the current price.
The stale $50 and $300 forecasts you should ignore
One older forecast table put ATOM at $100 to $150 in a conservative 2030 case and $250 to $350 in a bullish case. That table would need a market cap above $130 billion at current supply, which sits near Ethereum’s historic peak range.
No current data supports that jump from $1.62, so we exclude those tables from our bands.
Another older page put the 2030 base case at $18 to $25. That figure also predates the long slide to $1.62, and it assumes a recovery that current forecasts do not show.
We mention these numbers only so you can spot them elsewhere and discount them.
The current credible range for 2030
Current forecasts cluster much lower, and that clustering itself is useful information. PrimeXBT puts the 2030 average at $2.805, with a range from $2.067 to $3.535.
Gate puts the 2030 average at $3.38, with a range from $2.87 to $3.58. CryptoNews puts 2030 at $3.20, with a range from $2.33 to $4.30.
The bearish outlier comes from MidForex, an algorithmic model that puts the five year average near $0.75. That model extrapolates the downtrend, so it answers a different question from the others.
It shows what happens if nothing changes, not what must happen.
Our exclusive element in this article is the reconciliation below. We lined up these current forecasts on the same starting price, removed the stale tables, and built scenario bands from the remaining range.
You will not find this exact comparison, with October 2026 Hub developments factored in, in any single source we checked.
| Source | 2030 forecast | What it assumes |
|---|---|---|
| PrimeXBT | Average $2.805, range $2.067 to $3.535 | Slow base building, then gradual growth |
| Gate | Average $3.38, range $2.87 to $3.58 | Cross chain growth and a new market cycle |
| CryptoNews | $3.20, range $2.33 to $4.30 | Steady ecosystem growth to 2030 |
| MidForex (algorithmic) | Five year average near $0.75 | Downtrend continues with no change |
| Old $50 to $300 tables | Excluded | Stale assumptions from a far higher price |
Our scenario bands for 2026 to 2030
We built the bands below from the current forecasts above, not from analyst quotes. The base case follows the PrimeXBT and Gate range.
The bear case follows the algorithmic downtrend view, with room for a partial recovery. The bull case needs stronger demand than current forecasts assume, but it stays far below the stale $50 calls.
Read each year as a range, not a target. A range admits uncertainty, and crypto prices punish anyone who treats a forecast as a promise.
The table also shows why patience matters: even the bull case needs years, not weeks.
| Year | Bear case | Base case | Bull case |
|---|---|---|---|
| 2026 | $1.00 to $1.30 | $1.30 to $1.60 | $1.60 to $2.00 |
| 2027 | $1.00 to $1.40 | $1.40 to $2.00 | $2.00 to $2.90 |
| 2028 | $1.20 to $1.80 | $1.80 to $2.70 | $2.70 to $3.80 |
| 2029 | $1.40 to $2.20 | $2.20 to $3.30 | $3.30 to $4.50 |
| 2030 | $1.20 to $2.10 | $2.10 to $3.40 | $3.40 to $5.00 |
What the bear case needs
The bear case needs nothing dramatic. ATOM simply keeps losing ground to other ecosystems, and Bitcoin weakness drags it down with the wider market.
Bitcoin traded near $80,600 on October 25, 2026, below its short term averages, and the Federal Open Market Committee meets on October 27 to 28. A hawkish outcome there could pressure risk assets, including ATOM.
In this case, ATOM holders keep selling into every bounce. The price drifts sideways or lower, and each recovery fails below the 200 day average near $1.71.
That pattern already describes much of October 2026.
What the base case needs
The base case needs steady execution, not a boom. Cosmos keeps shipping IBC and SDK upgrades, app chains keep building, and the Hub finds paying demand for its services.
PrimeXBT maps this path year by year, with averages of $1.40 in 2026, $1.735 in 2027, $2.408 in 2028, $3.06 in 2029, and $2.805 in 2030.
Note the dip in that 2030 average versus 2029. PrimeXBT expects a cycle peak in 2029, then a cooler 2030, which matches how crypto cycles usually behave.
Our base band smooths that shape into a range, so readers do not fixate on one year’s average.
What the bull case needs
The bull case needs a real demand story, not just a market rally. Institutions must stake ATOM through new channels, app chains must bring users who actually pay fees, and Cosmos must win work that other stacks could also do.
Gate’s 2030 range of $2.87 to $3.58 shows how far even an optimistic current forecast goes, and our $5.00 bull top already stretches beyond it.
A bull case above $5.00 would need a new cycle peak plus a genuine Cosmos breakout at the same time. Both can happen, but betting on both at once is speculation, not a plan.
Treat anything above $5.00 by 2030 as a stretch outcome, not a central forecast.

What could actually move ATOM
Forecasts mean little without drivers, so here are the forces that matter most. The first group comes from October 2026 itself, from primary Cosmos Hub forum updates.
The second group covers the risks that could cancel the good news.
Start with the technology, because Cosmos sells infrastructure, not hype. The Cosmos SDK lets developers build custom blockchains, and IBC lets those chains talk to each other.
That design still appeals to teams that want their own chain, and it still faces the same weakness: independent chains can split liquidity and users across too many places.
October 2026 developments from the Hub itself
The Hub Weekly Update on October 15, 2026, reported that the Interchain Foundation stopped selling ATOM this year. That removes one source of selling pressure, but it does not create buying pressure by itself.
Buyers still need a reason to step in.
The same update confirmed Cosmos Hub and ATOM now appear on Paxos trading and custody pages, as the deliverable from Proposal 1054. Paxos custody can help institutions hold ATOM, yet custody availability alone has never lifted a token price.
It opens a door, and institutions still must choose to walk through it.
Governance also closed a difficult chapter in October. Proposal 1058 passed on October 12 with 99.7% support among non abstaining votes, and the Hub recovery multisig sent 1,227,121 recovered ATOM to Neutron on October 14.
The transfer followed a Neutron exploit, and it shows Hub governance can act under pressure. It does not change ATOM supply or demand in a material way.
Two more items point to the future. Hub version 29 sits on testnet, and an Ecosystem Growth delegation will fund InfStones to build an institutional ATOM staking API, starting with 597,794 ATOM.
If brokerages and custodians adopt that API, new institutional staking could follow. That outcome remains unproven, so we count it as potential, not as fact.
The risks that could break the forecast
Competition tops the risk list. Polkadot price prediction coverage shows a rival interoperability stack fighting for the same developers, and layer 2 bridges keep improving.
Cosmos must win developers project by project, and no single upgrade guarantees that win.
Token economics pose the second risk. ATOM has no fixed maximum supply, and Gauntlet research into issuance and demand continued through 2026 with no final redesign approved.
Staking rewards attract holders, but new issuance dilutes them, so demand must outrun supply for the price to rise. Staking platform guides explain this tradeoff in plain terms for beginners.
Market risk rounds out the list. ATOM fell about 48% over the past year while Bitcoin held near $80,600, which shows ATOM can fall even when Bitcoin holds up.
A broad crypto winter, harsh regulation, or a serious IBC bug could each push ATOM toward the bear band. Readers should size any position for that possibility.
How to read this prediction without getting burned
Most prediction articles fail readers in the same way. They show one number, hide the assumptions, and let readers mistake a guess for a guarantee.
This article does the opposite, and you can apply the same test to any forecast you read next.
Check the date first, then check the starting price. A forecast built when ATOM traded at $10 cannot guide a decision at $1.62 without a full rework.
Then check whether the author names what would prove them wrong, because a forecast with no failure condition is marketing, not analysis.
Avoid three common mistakes with ATOM specifically. Do not buy because an old article promised $50, do not sell in panic because one algorithmic model shows $0.75, and do not treat a single green week as a trend change.
ATOM has spent months below its moving averages, and one bounce does not reverse that structure.
For context on how other large coins face the same cycle problem, see our Tron price prediction 2026 2030 and Avalanche price prediction 2026 2030 guides. Both show the same pattern: strong technology, weak recent price, and forecasts that depend on demand nobody can guarantee.
Chainlink price prediction coverage adds a useful contrast, because Chainlink earns fees from oracle services in a more direct way than the Hub does today.
Storage and security matter as much as price targets. Our best decentralized crypto wallets guide helps beginners compare custody options before they buy anything.
Beginners who want the wider picture can also read our best blockchain projects in 2026 overview, which places Cosmos among its peers instead of in isolation.
FAQs
Readers ask the same five questions about ATOM, so here are direct answers with no hedging filler.
What is the Cosmos price prediction 2026 2030 in simple terms?
Our base case sees ATOM rebuilding from about $1.62 toward $2.10 to $3.40 by 2030, with a bear case near $1.20 to $2.10 and a bull case near $3.40 to $5.00. These are scenario bands, not promises, and they depend on real ecosystem demand.
Will ATOM reach $10 by 2030?
Current credible forecasts do not show $10 by 2030, and reaching $10 would need ATOM to rise more than six times from $1.62. That outcome would require a historic breakout plus a strong market cycle, so treat it as a stretch case, not a base case.
Is ATOM a good investment in 2026?
ATOM suits only investors who understand high risk and can hold through long drawdowns, because it trades 96% below its old high and below all major moving averages. This article is information only, not financial advice, and position size should reflect the real chance of further falls.
What is the lowest ATOM could fall to?
Our bear band bottoms near $1.00 in 2026 and 2027, and the algorithmic MidForex model averages near $0.75 over five years. ATOM traded as low as $1.22 over the past 52 weeks, so a move under $1.00 is possible in a broad market selloff.
What drives the Cosmos price most?
Real demand for Cosmos infrastructure drives ATOM most, including app chain growth, staking demand, and institutional use through channels like the new InfStones staking API. Bitcoin sentiment and market cycles still move ATOM day to day, but they cannot replace ecosystem demand over years.
Bottom line
ATOM at $1.62 is a fallen leader trying to rebuild, not a coin on the verge of an obvious comeback. The credible 2030 forecasts cluster near $2.80 to $3.38, and our bands stretch that view in both directions to account for real uncertainty.
If you follow ATOM, watch three signals instead of daily price noise. Watch whether institutional staking grows through the InfStones API, watch whether Hub version 29 and IBC upgrades bring new app chains, and watch whether ATOM can reclaim its 200 day average near $1.71.
Those signals will tell you sooner than any price target whether the base case or the bear case is winning.
Next step: bookmark this page and recheck it after the October 27 to 28 Federal Open Market Committee meeting, when the market mood for the rest of 2026 should get clearer. Prices will move before then, but the story will not change on one candle.