



Polkadot trades near $1.16 in October 2026, and most polkadot price prediction 2026 2030 models put DOT between $2 and $10 by 2030. Our own base case puts DOT at $5 to $10 by 2030, with a bear case at $0.70 to $2.50 and a bull case at $18 to $30.
That wide spread is the honest answer. Published 2030 calls run from under $1 in the most bearish models to about $10 at CoinStats, so any single number hides more than it tells you.

Key takeaways
- DOT trades near $1.16 on October 17, 2026, about 98% below its $55.00 all time high from November 4, 2021.
- Our base case: $1.20 to $1.90 in 2026, $1.80 to $3.20 in 2027, and $5 to $10 by 2030.
- A $10 price needs a market cap near $17.1 billion, about 8.6 times today. A $55 price needs about $93.9 billion.
- In March 2026 Polkadot capped supply at 2.1 billion DOT and cut annual issuance by 53.6%, a first in its history.
- Bitcoin still sets the weather. DOT has never built a lasting rally while Bitcoin fell.
Polkadot Price Today: Where DOT Stands in October 2026
DOT changes hands near $1.16 on October 17, 2026, with a market cap near $2.0 billion. About 1.708 billion coins circulate, out of a new hard cap of 2.1 billion set in March 2026.
- Polkadot Price Today: Where DOT Stands in October 2026
- Our Polkadot Price Prediction 2026 2030 at a Glance
- What Other Forecasters Say About DOT
- The Market Cap Reality Check Most Forecasts Skip
- Polkadot Price Prediction by Year
- Polkadot Price Prediction 2026
- Polkadot Price Prediction 2027
- Polkadot Price Prediction 2028
- Polkadot Price Prediction 2029
- Polkadot Price Prediction 2030
- The Drivers That Will Decide Each Case
- Polkadot 2.0 and Agile Coretime Adoption
- JAM, the Upgrade Bulls Are Really Betting On
- The March 2026 Supply Cap and Lower Inflation
- Staking, the DOT ETF and Bitcoin Direction
- Risks That Could Break These Forecasts
- Common Mistakes People Make With DOT Forecasts
- Frequently Asked Questions
- Conclusion: A Range, a Test, and a Watchlist
Bitcoin trades near $81,720 on the same day, and that number matters for every forecast below. You can see why in our Bitcoin price prediction for 2026, because DOT rallies rarely survive a falling Bitcoin for long.
The Levels Traders Watch Right Now
Support sits first at $1.11 to $1.12, then at the 50 day average near $1.08 and at $1.04. DOT set a new all time low near $0.73 in August 2026, so a loss of $1.04 would worry holders fast.
Resistance sits at $1.29 to $1.30, where the upper Bollinger Band capped price this month. A clean break through $1.30 to $1.33 opens $1.40, while a break below $1.11 risks a slide back toward $1.04.

Our Polkadot Price Prediction 2026 2030 at a Glance
We built three cases for each year instead of one target. Each case names the conditions that would make it real, so you can judge the forecast as events unfold.

| Year | Bear case | Base case | Bull case |
|---|---|---|---|
| 2026 | $0.75 to $1.05 | $1.20 to $1.90 | $2.60 to $4.00 |
| 2027 | $0.65 to $1.20 | $1.80 to $3.20 | $4.50 to $7.00 |
| 2028 | $0.80 to $1.60 | $2.50 to $4.50 | $7.00 to $12.00 |
| 2029 | $0.90 to $2.00 | $3.50 to $6.50 | $12.00 to $20.00 |
| 2030 | $0.70 to $2.50 | $5.00 to $10.00 | $18.00 to $30.00 |
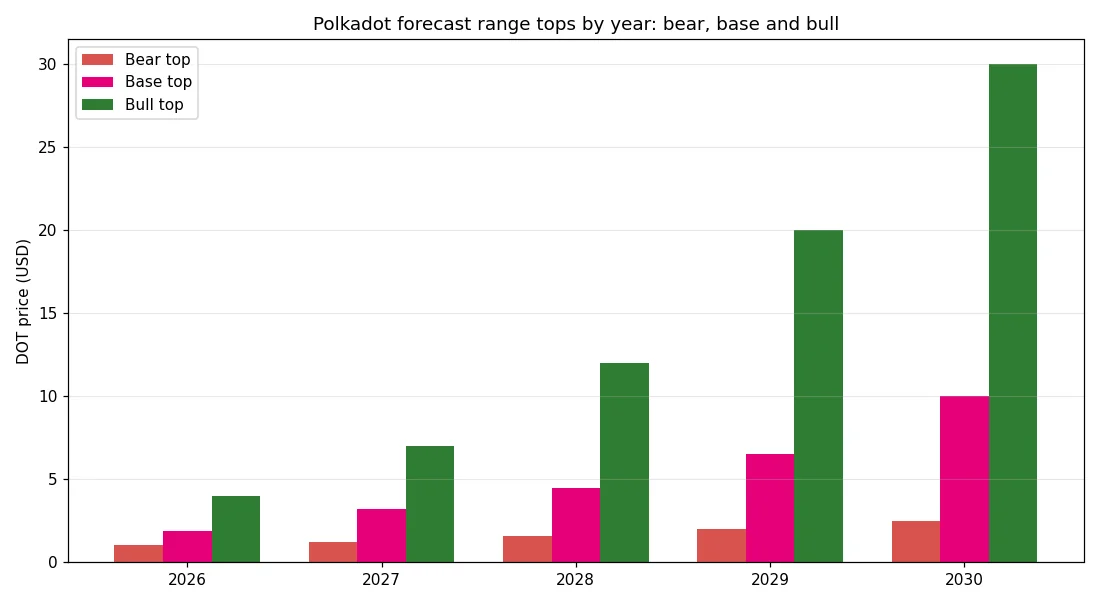
Notice what the bull case never does in our table. It does not hand DOT a new all time high by 2030, because the market cap math in the next sections makes a return to $55 very hard.
What Other Forecasters Say About DOT
Published models disagree wildly, and the disagreement itself is useful information. A model that leaves DOT under $2 for five years and a model that sends it past $15 cannot both rest on the same view of adoption.
| Source | 2026 | 2027 | 2030 |
|---|---|---|---|
| CoinBird model | $2.12 average | $3.86 average | $6.36 average |
| CoinStats ranges | $0.75 to $1.80 | $0.65 to $2.75 | $0.70 to $10.00 |
| GODEX analyst synthesis | $1.40 to $3.20 base | $2.20 to $6.50 base, with 2028 | $6.80 to $15.00 base |
| Changelly | About $1.10 average | Not stated | Not stated |
Most of these models lean on price history and trend math. They rarely test whether the market cap at their target price makes sense, which is exactly the check we run next.
For a useful contrast, compare how forecasters treat a rival smart contract chain in our Cardano price prediction for 2026 to 2030. ADA models show the same wide spread, for the same reasons.
The Market Cap Reality Check Most Forecasts Skip
Here is the part you will not find in the model tables above. We multiplied each headline DOT price by the live circulating supply of about 1.708 billion coins, so you can see the market cap each target quietly assumes.
| DOT price | Implied market cap | Multiple of today |
|---|---|---|
| $1.16 (today) | About $2.0 billion | 1x |
| $5 | About $8.5 billion | About 4.3x |
| $10 | About $17.1 billion | About 8.6x |
| $25 | About $42.7 billion | About 21x |
| $55.00 (all time high) | About $93.9 billion | About 47x |
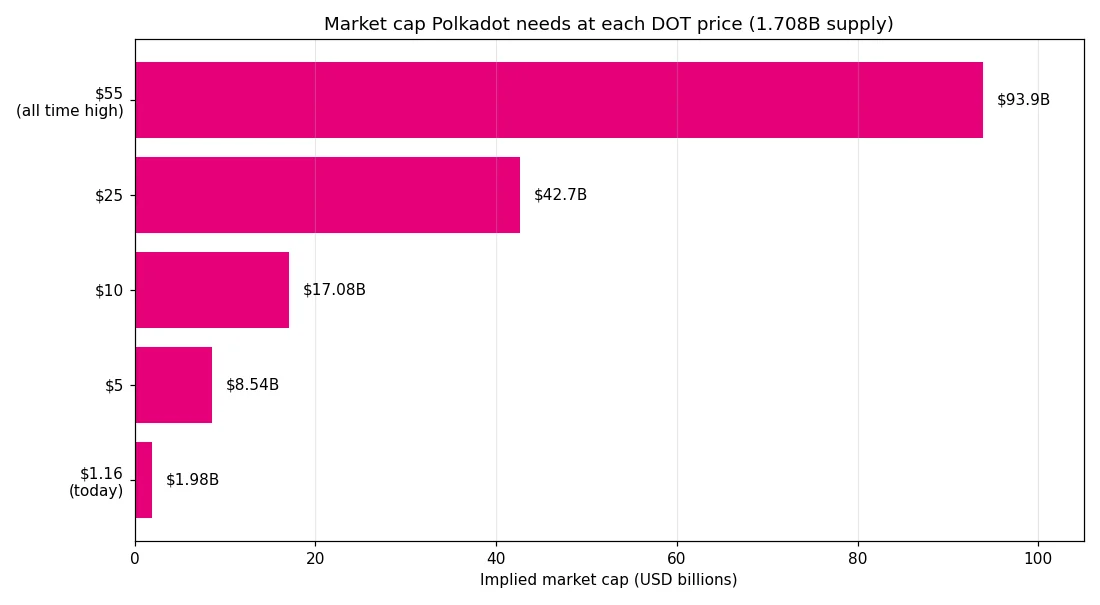
Two warnings belong with this table. First, supply will grow toward the 2.1 billion cap, so the same price would need an even bigger cap later.
Second, DOT traded near a $55 billion cap at its 2021 peak with far fewer coins in circulation. A return to $55 now needs roughly $93.9 billion, which needs a full bull market with real demand, not hope.
What $10 and $25 Would Really Take
A $10 DOT needs buyers to value Polkadot near $17.1 billion. That is roughly where strong layer 1 chains sat in past bull markets, so our base case reaches it only by 2030.
A $25 DOT needs about $42.7 billion, more than twenty times today. Forecasts that promise $25 early, like the most bullish targets we test in our Chainlink price prediction for 2026 to 2030, should always face this same cap test.
Polkadot Price Prediction by Year
Year by year, the story changes. The near years hinge on Bitcoin and on coretime sales, while the later years hinge on whether JAM ships and pulls real users in.
Polkadot Price Prediction 2026
Our base case puts DOT at $1.20 to $1.90 for the rest of 2026. The March supply cut helps slowly, because 1.708 billion coins already circulate and lower issuance tightens the float over years, not weeks.
The bull case at $2.60 to $4.00 needs Bitcoin to reclaim its highs and risk appetite to return. The bear case at $0.75 to $1.05 fits a deeper altcoin slide, close to the August low near $0.73.
Polkadot Price Prediction 2027
Our base case for 2027 is $1.80 to $3.20. That range sits below the CoinBird model at $3.86 average, because we want JAM progress in hand before we pay for it in the forecast.
By 2027 the JAM testnet story should turn into a mainnet date, or it will start to hurt the price instead of helping it. Watch coretime revenue and active chains more than social media buzz.
Polkadot Price Prediction 2028
Our base case for 2028 is $2.50 to $4.50, with a bull case at $7 to $12. A Bitcoin halving year tends to lift the whole market, and our Bitcoin price prediction for 2030 explains that cycle math in full.
The bear case at $0.80 to $1.60 assumes Polkadot loses builder share to rival chains. Ethereum and Solana will not stand still, as our Ethereum price prediction for 2026 to 2030 makes clear.
Polkadot Price Prediction 2029
Our base case for 2029 is $3.50 to $6.50. Late cycle years often bring the wildest moves in both directions, so the gap between our $0.90 bear floor and $20 bull top is widest here.
Staking demand matters more by then. If institutions hold DOT at scale through regulated products, the liquid supply shrinks and rallies can run further on the same buying.
Polkadot Price Prediction 2030
Our base case for 2030 is $5 to $10, and our bull case is $18 to $30. That bull top still sits well below the $55.00 all time high, which tells you how much damage the long slide from 2021 did.
The CoinBird average of $6.36 lands inside our base case, and the CoinStats high of $10.00 lands at its top. The GODEX base range of $6.80 to $15 runs hotter than ours, mainly because it pays more for JAM success up front.
The Drivers That Will Decide Each Case
Forecasts fail when the drivers change, not when the math breaks. Five drivers matter most for DOT over the next five years.
Polkadot 2.0 and Agile Coretime Adoption
Polkadot 2.0 is essentially complete, with Async Backing, Agile Coretime and Elastic Scaling all shipped. Agile Coretime scrapped the old slot auctions and lets teams buy blockspace by the month or by the block.
That change lowers the cost of building on Polkadot a lot. The bull case needs coretime sales to turn into steady DOT demand, because low network revenue has stayed the weakest number in the whole Polkadot story.
JAM, the Upgrade Bulls Are Really Betting On
JAM, short for the Join Accumulate Machine, would replace the Relay Chain with a more general computer that supports RISC-V and smart contracts at the core layer. Its testnet went live in January 2026 with several conformant clients.
Mainnet still had no confirmed date in October 2026, and ecosystem estimates now point to 2027 or later. A clean JAM launch is the single biggest upside driver in our bull case, and a long slip is the biggest risk in our bear case.
The March 2026 Supply Cap and Lower Inflation
Governance votes in referendums 1710 and 1828 capped supply at 2.1 billion DOT in March 2026. The same change cut annual issuance by 53.6%, from about 120 million DOT to about 56.88 million.
Annual inflation fell from about 7.5% to about 3.3% at once. That removes the old uncapped inflation attack on DOT, but it works as a slow burn, because the coins already in circulation still dominate the float.
Staking, the DOT ETF and Bitcoin Direction
Staking still locks up a large share of DOT and pays holders who secure the network. Lower issuance will squeeze staking yields over time, so demand has to come from use, not only from yield hunting.
The 21Shares Polkadot ETF, TDOT, launched on Nasdaq in March 2026 and gave US investors a regulated route to DOT. Steady inflows there would add real buying, much like the flows we track in our Avalanche price prediction for 2026 to 2030 for rival layer 1 tokens.
Above all of this sits Bitcoin. Our Solana price prediction for 2030 shows the same pattern, because no large altcoin has held a major rally while Bitcoin fell for long.
Risks That Could Break These Forecasts
The biggest risk is simple. DOT fell about 98% from its high while its technology kept improving, which proves that good tech alone does not hold a price.
Competition is the second risk. Ethereum layer 2s, Solana and newer chains all chase the same builders, and they now offer shared security stories that once belonged to Polkadot alone.
Value capture is the third risk. Coretime prices and network fees stay very low, so a busier Polkadot ecosystem does not always mean strong demand for DOT itself.
Common Mistakes People Make With DOT Forecasts
The first mistake is treating one model output as a promise. A forecast is a scenario with assumptions, and the assumptions break long before the date arrives.
The second mistake is ignoring the market cap behind a price target. The third mistake is forgetting that DOT still trades like a high risk altcoin near its lows, so position size matters more than any single prediction.
Frequently Asked Questions
What is the Polkadot price prediction for 2030?
Our base case puts DOT at $5 to $10 by 2030, with a bear case at $0.70 to $2.50 and a bull case at $18 to $30. Published forecasts for 2030 range from under $1 in bearish models to about $10 at CoinStats and $6.36 on average at CoinBird.
Can Polkadot reach $10 by 2030?
Yes, it can, and $10 sits at the top of our base case. A $10 price needs a market cap near $17.1 billion at the current supply, about 8.6 times the level in October 2026.
Will DOT reach its all time high of $55 again?
It could one day, but none of our cases assume it by 2030. A $55 price needs a market cap near $93.9 billion at the current supply, and supply growth toward the 2.1 billion cap pushes that bar higher.
What will Polkadot be worth in 2027?
Our base case puts DOT at $1.80 to $3.20 in 2027. Published models average about $3.86 at CoinBird for that year, while cautious models stay closer to $2.
Is Polkadot a good long term buy?
Nobody can promise that, and this article is not financial advice. DOT now has a capped supply and finished 2.0 upgrades, but it also fell about 98% from its high, so only risk money you can afford to lose.
Conclusion: A Range, a Test, and a Watchlist
Our polkadot price prediction 2026 2030 work points to $5 to $10 by 2030 in the base case. The market cap test keeps that call honest, and the driver watchlist tells you early if the base case starts to fail.
Your next step is simple. Check the $1.11 support zone, the $1.30 resistance band, and the coretime revenue numbers each quarter before you trust any new forecast, including ours.