



Bitcoin rejected at 87000 is the story traders woke up to on October 6. Bitcoin fell 1.2% to about $85,600 after sellers pushed it back from above $87,000. It was the third rejection at that level since September 23.
The short answer is simple. Buyers keep lifting the price from higher lows, but sellers keep defending $87,000. That squeeze has formed a triangle, and the price is now close to its tip, called the apex. When a triangle gets this tight, a bigger move often follows.

This guide walks you through the pattern step by step. You will learn what the triangle means, which levels matter most, and what could trigger the next move up or down.
- Bitcoin fell 1.2% to about $85,600 on October 6 after a third rejection above $87,000 since September 23.
- FxPro analyst Alex Kuptsikevich told CoinDesk the price has reached the apex of a triangle made of flat resistance and rising support.
- The main support zone sits between $83,300 and $84,600, where on-chain data shows heavy past trading.
- The broader crypto market slipped to about $2.93 trillion, while the Nasdaq 100 closed at a record.
- The 10-year Treasury yield held near 5.32%, a level last seen around 2002, which keeps pressure on risk assets.
What Happened on October 6
Bitcoin tried to climb above $87,000 on Monday and failed again. Sellers stepped in fast, and the price slid to about $85,600 in Asian trading on Tuesday, October 6.
The drop was not just a Bitcoin story. Ether, XRP, Solana and Dogecoin each fell between 1% and 2%, and BNB lost 2.5%. Cardano stood out with an 11% jump, while HYPE gained 3% to about $94.
The numbers behind the move
CoinGecko data put Bitcoin near $85,500, with a 24-hour range of about $85,010 to $86,662. Its market value sat close to $1.72 trillion.
That price is about 32% below the all-time high of $126,080 set on October 6, 2025, exactly one year earlier. If you want the wider context, our Bitcoin price prediction for October 2026 maps the levels that could decide the rest of the month.

Why $87,000 Keeps Blocking Bitcoin
A resistance level is a price where sellers tend to show up in force. At $87,000, that has now happened three times since September 23.
Each failed try tells you something. Sellers are still willing to sell at that price, and buyers have not yet brought enough demand to absorb that supply and hold above it.
Step 1: Watch for a daily close above $87,000
A brief spike above $87,000 is not a breakout. Traders usually want to see a daily close above the level, followed by a hold on the next test.
On-chain analyst Ali Martinez put the line a little lower, at $86,700. Above that point, his data showed no dense supply zone until around $105,000, which is why a clean break could move fast.
How the Triangle Pattern Works
A triangle forms when the price range keeps getting smaller. Here, the top is flat at $87,000, while the bottom keeps rising as buyers step in earlier on each dip.
Kuptsikevich noted that Bitcoin has built a trend of higher local lows since last week. In his view, the bulls have been unable to gain momentum, even though the lows keep rising.
Step 2: Mark the apex on your chart
The apex is where the flat top and the rising bottom meet. As the price nears that point, the range has almost no room left, so a break one way or the other becomes more likely.
The pattern does not tell you the direction. It tells you to prepare for volatility, which is why many traders wait for confirmation instead of guessing.
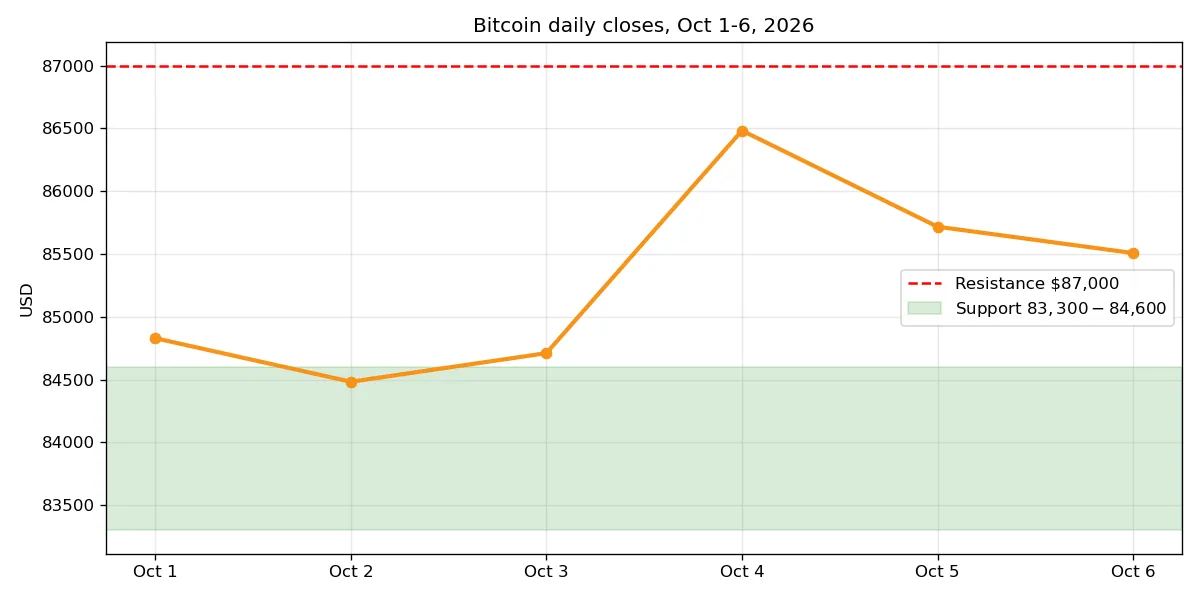
Bitcoin daily closes from October 1 to 6, 2026, with the $87,000 resistance line and the $83,300 to $84,600 support zone. Data: daily price history for early October 2026.
The Support Levels Below the Price
If the triangle breaks down, the first question is where buyers might step in. The clearest zone sits between $83,300 and $84,600.
Martinez linked that zone to Glassnode data showing roughly 1.59 million BTC changed hands there. When many coins last traded in one zone, that zone often acts as support on the way down.
Step 3: Know the deeper levels
Below that zone, traders cited $82,500 and then $82,000. One market analysis warned that a break below $82,000 would weaken the recent bullish structure in a material way.
The $85,000 area also matters day to day. Analyst Daan Crypto Trades noted it has acted as both support and resistance on near-daily tests in recent sessions.
Resistance tested three times since Sept 23
Main on-chain support zone below price
10-year Treasury yield on October 6
What Stocks and Bonds Are Telling Traders
Stocks did not share Bitcoin’s problem. The Nasdaq 100 closed at a record, and the S and P 500 finished within 0.5% of its all-time high.
Bonds were the headwind. The 10-year Treasury yield rose to 5.32%, around levels last seen in 2002, and the two-year yield climbed to 4.83%. High yields give big investors a safe return, which can pull money away from assets like Bitcoin.
Macro news still matters for the next leg. Our look at the Bitcoin jobs report move past $87K shows how softer US payrolls changed rate-hike odds earlier this month. The Bitcoin Fed rate cut prediction explains the other side of that coin.
The next macro test is already here. See today’s Fed FOMC minutes preview for Bitcoin for the five clues that could finally tip this $87,000 fight one way or the other.
ETF Flows and Whale Buying
Institutional demand cooled at the start of this week. US spot Bitcoin ETFs recorded about $89.9 million in net outflows on October 5, after inflows of about $102.7 million on October 1 and $189.8 million on October 2.
BlackRock’s IBIT was an exception, with an inflow of about $69.9 million on October 5. You can compare that with the stronger pattern in September Bitcoin ETF inflows of $2.65 billion and the start of this month in Bitcoin ETFs opening October with $103M inflows.
A quiet bullish signal
Large holders have been buying the dips. Martinez, citing Santiment data, said big wallets added more than 14,335 BTC since October 1, worth about $1.22 billion at the prices in his analysis.
Whale buying alone does not set the next direction. Still, it helps explain why each dip has found buyers at a higher low than the last one.
What Happens Next: Two Clear Scenarios
The bullish case starts with a daily close above $87,000, or above $86,700 on the on-chain view. That would suggest selling at the level has dried up and could open the path toward the highest prices in eight months.
The bearish case starts with a loss of the $83,300 to $84,600 zone. That would break the rising support line, end the triangle on the downside, and put $82,500 and $82,000 in focus.
Common mistakes to avoid
The first mistake is treating a quick spike as a breakout before the daily close confirms it. The second is ignoring the bond market, since a 5.32% yield is a real headwind, not background noise.
For a longer view beyond this week, see our Bitcoin price prediction 2026 with year-end targets. It puts this range fight into the full-year picture.
FAQs
Why was Bitcoin rejected at $87,000 three times?
Sellers have defended $87,000 since September 23. Each rally into that level met enough selling to push the price back, most recently on October 6, when Bitcoin fell 1.2% to about $85,600.
What is the triangle apex in Bitcoin’s chart?
It is the point where flat resistance at $87,000 meets rising support from higher local lows. As price reaches the apex, the range runs out of room, and analysts expect higher volatility after a break.
What support levels matter if Bitcoin falls?
The main zone is $83,300 to $84,600, where on-chain data shows about 1.59 million BTC changed hands. Below that, traders watch $82,500 and $82,000.
What would confirm a bullish breakout?
A daily close above $87,000 that holds on a retest. On-chain analyst Ali Martinez puts the key line at $86,700, with little dense supply above it until around $105,000.
Conclusion
Bitcoin is squeezed between a wall it cannot yet climb and support that keeps rising. That is a tense setup, and it rarely lasts long.
The next step for readers is simple. Watch the daily close against $87,000 on top and $83,300 to $84,600 below, and let the break, not the noise, tell you which side won.