



Injective price prediction 2026-2030 starts with a coin that finally has something new to talk about. INJ trades near $8.10 on November 9, 2026, and the first staked INJ exchange-traded fund started trading on Nasdaq just four days ago.
Our short answer is this. Our base case puts INJ near $16 by 2030, with a bull case near $35 and a bear case near $7.

Nobody knows the real outcome. The published forecasts for 2030 run from about $11 to about $59, and that spread tells you more about this coin than any single number does.
- Key Takeaways
- Injective (INJ) Price Today: Where It Stands on November 9, 2026
- What Is Injective, in Plain Words
- The Big Story Right Now: A Staked ETF Just Started Trading
- INJ Price Journey: From $4 to $8 in Six Months
- Injective Price Prediction 2026
- Injective Price Prediction 2027
- Injective Price Prediction 2028
- Injective Price Prediction 2029
- Injective Price Prediction 2030
- What the Forecasters Actually Disagree About
- The Burn Story: Why “Deflationary” Needs a Second Look
- What Could Push INJ Higher
- Key Levels Traders Are Watching
- Common Mistakes With INJ Predictions
- Frequently Asked Questions
- What is the Injective price prediction for 2026?
- Can Injective reach $50 again?
- Is Injective a good investment in 2026?
- What is the highest Injective could go by 2030?
- Why did Injective rise in November 2026?
- Where can I buy Injective (INJ)?
- The Bottom Line
INJ trades near $8.10 on November 9, 2026, based on live price pages that put it between about $7.96 and about $8.24 during the day. Its market value sits near $810 million, with 100 million coins in circulation, and it ranks around 79 among all cryptocurrencies.
That puts Injective about 85 percent below its March 2024 peak near $52.75, and it is up about 93 percent from where it traded six months ago. The ETF launch gives the story a fresh catalyst, but the token still has to prove it can hold the gains.
Key Takeaways
- INJ trades near $8.10 on November 9, 2026, with a market value near $810 million, rank 79, and 100 million coins in circulation.
- INJ is up about 12.7 percent in the last 7 days and about 15.8 percent in the last 30 days, and it closed November 8 at $8.12 after touching $8.30 on November 6.
- Canary Capital’s staked INJ ETF (INJC) started trading on Nasdaq on November 5, 2026, and it gathered $16.12 million in net assets in its first two sessions.
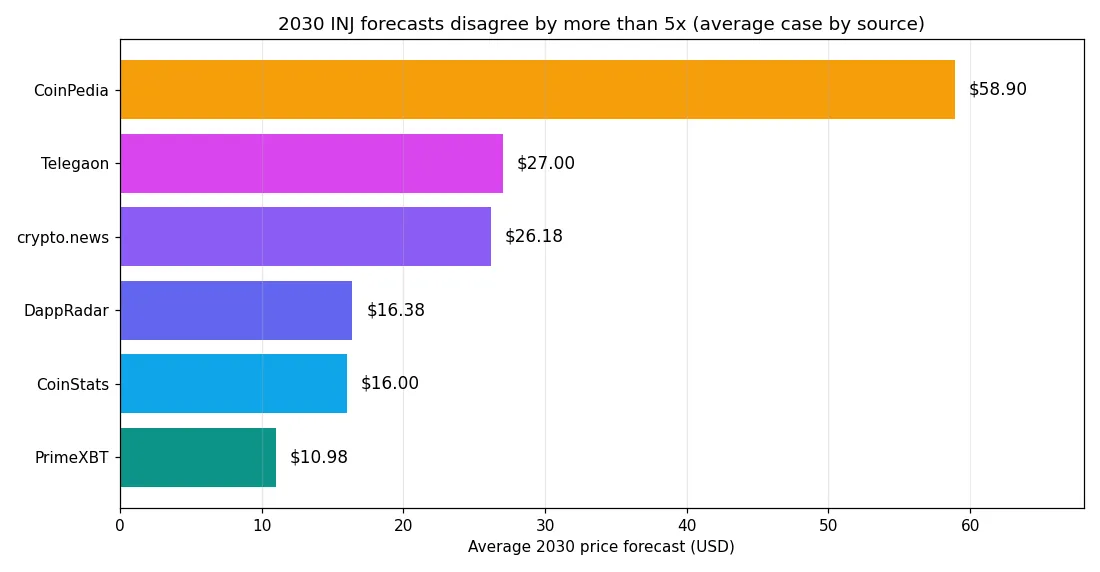
- Published 2030 forecasts disagree by more than five times, from a $10.98 average at PrimeXBT to a $58.90 average at CoinPedia.
- This article translates every published 2030 forecast into market value, so you can see what each target would actually require. A $50 INJ needs a $5 billion market value, just below the record market value near $5.3 billion from 2024.
- Our 2030 scenario bands run from $7 in the bear case to $35 in the bull case, with $16 as the base case. None of this is investment advice.
Injective (INJ) Price Today: Where It Stands on November 9, 2026
INJ woke up to a quiet session on November 9, 2026. It trades near $8.10, down a fraction in 24 hours, after a strong week that carried it from about $6.98 on November 2 to about $8.30 on November 6.
Bitcoin sets the mood for the whole market, and it sits near $75,000 after falling from above $80,000 earlier in the week. INJ held up better than most altcoins during that slide, which tells you buyers stepped in on the ETF news instead of selling it.

| INJ snapshot | November 9, 2026 |
|---|---|
| Price | About $8.00 to $8.13 |
| 24-hour range | $7.82 to $8.29 |
| Market value | About $810 million |
| Market rank | About 79 |
| Circulating supply | 100 million INJ |
| 24-hour trading volume | About $64 million to $82 million |
| Change, last 7 days | Up about 12.7 percent |
| Change, last 30 days | Up about 15.8 percent |
| Change, last 6 months | Up about 92.9 percent |
| Change, year to date | Up about 78.9 percent |
| All-time high | About $52.75 in March 2024 |
The 14-day relative strength index sits near 54 to 56, which reads as neutral with a slight lean toward buyers. That matters because INJ is not overheated after its run, yet it is no longer oversold either.
Traders watch $7.80 as the nearest support and $8.30 as the nearest resistance. A clean break above $8.30 opens the path toward the $8.69 to $9.00 zone, while a loss of $7.80 would put the November 2 low near $6.98 back in play.
What Is Injective, in Plain Words
Injective is a layer-1 blockchain built for finance. It runs its own chain on the Cosmos software kit, and it ships with a built-in order book so developers can launch spot, futures, and other trading markets without building that plumbing themselves.
Eric Chen and Albert Chon founded the project in 2018, and Binance Labs backed it early. The chain went live in November 2021, and it added an Ethereum-compatible environment in 2025 so Ethereum apps could deploy on it too.
Think of Injective as a trading venue that lives on a blockchain instead of in a company server room. Exchanges, derivatives apps, and tokenized-asset markets run on top of it, and they share their fees with the network.
Why traders care about the order book
Most blockchains leave the order book to each app, which splits liquidity across many small pools. Injective puts one shared order book at the chain level, so every app on the network can tap the same liquidity.
That design is the whole pitch. If on-chain trading keeps growing, a chain built for trading should win more of that activity than a general-purpose chain that treats trading as one app among many.
The catch is scale. Injective’s DeFi total value locked sits near $19 million, which is tiny next to Solana or Ethereum.
Rivals such as Hyperliquid already lead in on-chain trading volume. Our Hyperliquid price prediction covers that rival in detail, and the comparison shows how far Injective still has to climb.
The Big Story Right Now: A Staked ETF Just Started Trading
Canary Capital’s staked INJ ETF, ticker INJC, started trading on Nasdaq on November 5, 2026. Nasdaq cleared the listing on November 4, and Injective’s chief executive rang the opening bell to mark the launch.
The fund gathered $16.12 million in net assets during its first two trading sessions. That is a small start next to the billions that flowed into Bitcoin ETFs, but it is a real start, and it puts INJ inside the regulated US fund market for the first time.
Two more INJ ETF filings sit in the pipeline from 21Shares and REX-Osprey. One approval is a milestone, and a second or third approval would tell the market this is a trend rather than a one-off.
What the first two days showed
INJ closed November 4 at $7.94, then jumped to $8.15 on November 5 and $8.30 on November 6. The ETF launch lined up with the strongest two-day move of the month, and volume spiked with it.
Price then cooled to $8.12 by November 8, which is normal after a news-driven jump. The key test now is whether the fund keeps gathering assets in its second week, because steady inflows would give INJ a new buyer that did not exist before November.
The ETF angle is not unique to Injective. Our XRP price prediction shows how ETF approval talk moved another altcoin this year, and the pattern is the same: funds bring in buyers who never touch a crypto exchange.
INJ Price Journey: From $4 to $8 in Six Months
INJ spent most of the summer of 2026 stuck near $4 to $5. It closed May 9 at $4.21, drifted near $4.87 on August 1, and still sat at $4.93 on August 31.
September changed the mood. INJ closed September 30 at $7.41, a jump of about 50 percent in a single month.
It has held most of that gain since. October brought swings between $6.94 and $8.06, and November opened with a dip to $6.98 before the ETF news pushed it back above $8.
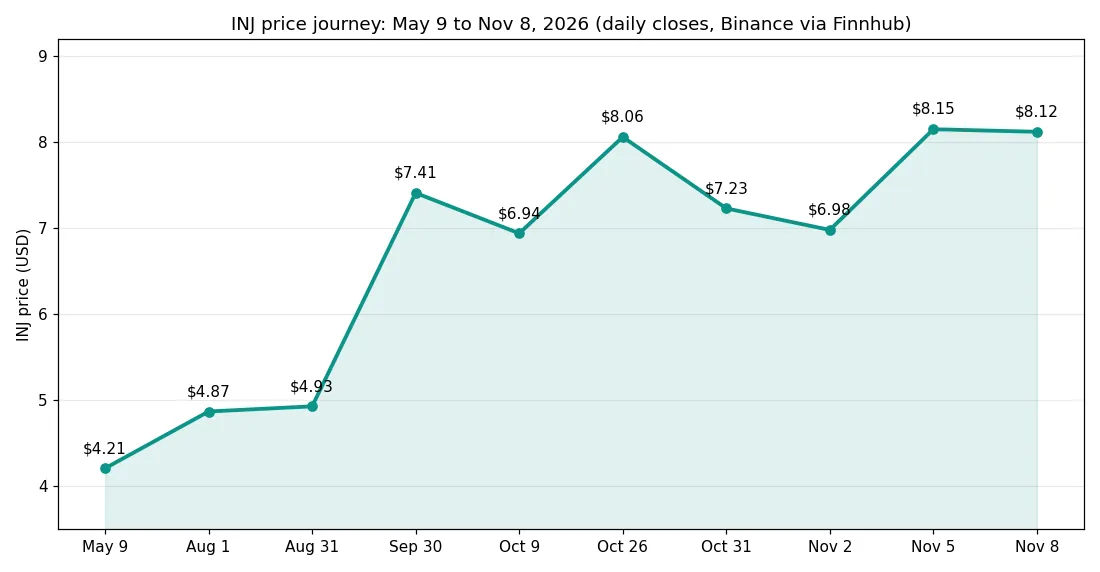
The chart above uses real daily closes from Binance. It shows a coin that doubled in six months, yet still trades about 85 percent below its record high.
That gap is the whole debate in one picture. Bulls see a coin that has finally turned the corner after a long slide, while bears see a coin that rallied hard and still sits far from where it peaked in 2024.
Injective Price Prediction 2026
The rest of 2026 looks like consolidation around current levels. Most published forecasts put INJ between about $6.50 and about $11.58 by the end of the year, with averages clustering near $8 to $9.65.
One number needs a careful read. PrimeXBT lists a 2026 average near $5.48, but that is a full-year average that includes the months when INJ traded near $4.
It does not mean the site expects a fall from $8.
| Source | 2026 low | 2026 average | 2026 high |
|---|---|---|---|
| PrimeXBT | $4.10 | $5.48 | $7.20 |
| CoinStats | $6.50 | $8.00 | $10.50 |
| DappRadar | – | $8.64 | – |
| crypto.news | $8.20 | $9.65 | $11.58 |
| Telegaon | $6.00 | $9.50 | $13.00 |
| CoinPedia | $3.80 | $8.83 | $15.33 |
Our 2026 view is simple. Our base case puts INJ near $9 by the end of the year, with a bull case near $11.50 if ETF inflows keep growing and a bear case near $6.50 if Bitcoin slides again.
Bitcoin drives the short term more than any Injective news does. Our Bitcoin rebound above $80,000 article shows how fast the mood can flip, and INJ will follow Bitcoin down if the wider market turns.
Injective Price Prediction 2027
2027 is the year most forecasters expect the trend to turn convincingly. The published averages run from $8.86 at PrimeXBT to $18.60 at CoinPedia, with CoinStats at $10.00, DappRadar at $11.73, crypto.news at $11.04, and Telegaon at $15.00.
The bull case rests on the ETF story maturing. If at least one more US INJ ETF goes live in 2027 and staking plus burn flows attract steady institutional money, the $16 high end of the CoinStats range comes into view.
The bear case is a delay. If ETF approvals stall and the crypto market weakens, INJ could slide back toward its 2026 lows near $5.50.
Our base case for 2027 sits near $11, which lines up with the middle of the published range.
Injective Price Prediction 2028
2028 is the cycle-high year in several models, and the forecasts start to spread wide. PrimeXBT sees an average near $13.30, CoinStats sees $13.00, DappRadar sees $14.29, crypto.news sees $14.72, Telegaon sees $18.00, and CoinPedia sees $32.40.
That spread says something useful. The cautious models agree on a $13 to $15 zone, while the optimistic ones need a full market recovery plus real growth in Injective’s derivatives and tokenized-asset volumes.
Our base case for 2028 sits near $14, with a bull case near $24 and a bear case near $6. The bull case needs the network to win a bigger share of on-chain finance, not just a rising market.
Injective Price Prediction 2029
2029 reads as the cool-down year after the peak in several forecasts. PrimeXBT sees an average near $12.18, slightly below its 2028 view, while CoinStats holds $13.00, DappRadar sees $15.45, crypto.news sees $20.45, Telegaon sees $22.00, and CoinPedia sees $48.70.
The honest read is that nobody can model 2029 with confidence. Three years out, the forecast depends on whether Injective becomes a core piece of DeFi infrastructure or stays a niche trading chain.
Our base case for 2029 sits near $15, with a bull case near $28 and a bear case near $7. Treat the wide range as the point: the further out the year, the wider the honest range should be.
Injective Price Prediction 2030
By 2030 the forecasts split by more than five times. PrimeXBT sees an average near $10.98, CoinStats sees $16.00, DappRadar sees $16.38, crypto.news sees $26.18, Telegaon sees $27.00, and CoinPedia sees $58.90.
The gap between the lowest and highest average is about $48. That is not a rounding error, and it tells you these models use very different guesses about adoption, competition, and the overall crypto market in 2030.
Our base case for 2030 sits near $16, which matches the middle of the published range. Our bull case sits near $35, and our bear case sits near $7.
None of these numbers is a promise, and all of them depend on a market that has humbled forecasters before.
What the Forecasters Actually Disagree About
Most prediction articles list the forecasts and stop there. That hides the real question, which is what each target would actually require, so we translated every published 2030 average into market value at the current 100 million circulating supply.
| Source | 2030 average | Implied market value at 100M supply |
|---|---|---|
| PrimeXBT | $10.98 | $1.10 billion |
| CoinStats | $16.00 | $1.60 billion |
| DappRadar | $16.38 | $1.64 billion |
| crypto.news | $26.18 | $2.62 billion |
| Telegaon | $27.00 | $2.70 billion |
| CoinPedia | $58.90 | $5.89 billion |
Here is the part no other prediction page spells out. At its March 2024 peak near $52.75, INJ carried a market value near $5.3 billion, so CoinPedia’s $58.90 average would need a market value above the all-time-high market value.
That does not make it impossible, but it sets the bar. A $50 INJ needs a $5 billion market value, just below the 2024 record, while a $16 INJ needs only a $1.6 billion market value, about double today’s level.
The same test works for every target. When you see a big number, multiply it by 100 million and ask whether that market value looks realistic next to the chains INJ competes with.
That one check filters out most fantasy forecasts in seconds.
Other prediction articles on this site use the same test. Our Render price prediction translates its forecasts the same way, and our Bittensor price prediction does too, so you can compare the three coins on equal terms.
The Burn Story: Why “Deflationary” Needs a Second Look
Many articles call INJ deflationary and stop there. The real picture is more interesting, and more honest, than that label suggests.
Injective has burned about 7.27 million INJ in total through its burn auction and its monthly Community BuyBack. Holders commit INJ each month, those tokens burn forever, and participants share a basket of ecosystem revenue in return.
But new issuance still runs ahead of burns. Total supply stood near 122.9 million INJ in mid-September 2026, about 23 percent above the 100 million genesis supply, and the annualized issuance rate sat at 4.40 percent.
Governance approved the IIP-617 Supply Squeeze to cut new issuance and speed up burns, and that change points in the right direction. Yet burns only turn the token net deflationary when ecosystem revenue grows enough to outpace staking rewards, and that has not happened yet.
The lesson for a prediction is simple. Count the burn as a plus, but do not treat it as a guarantee of rising prices.
A token can burn millions of coins and still fall if demand stays flat, and INJ proved that in 2025 and early 2026.
What Could Push INJ Higher
Three forces could lift INJ from here. ETF inflows are the first, because a fund that keeps buying gives the token a steady new source of demand that retail traders cannot match alone.
Real usage is the second. Injective’s network claims its real-world-asset perpetuals passed $1.1 billion in volume this year, and rising derivatives volume feeds the burn through fees.
More volume means more fees, more burns, and a stronger story.
The wider market is the third. INJ is up about 93 percent in six months, yet it still sits 85 percent below its peak, so a broad crypto recovery would lift it with the rest of the market.
What could drag it down
The risks are just as real. Bitcoin still drives altcoins, and a slide below $70,000 would likely pull INJ back toward $7 or lower no matter what the ETF does.
Competition is the second risk. Solana and Hyperliquid already lead in on-chain trading, and Injective’s $19 million in DeFi total value locked shows how small its ecosystem still is.
A chain can have great technology and still lose the liquidity race.
Token supply is the third risk. New issuance near 4.40 percent a year dilutes holders unless burns catch up, and that math only improves if network revenue grows.
Our Arbitrum price prediction faces a similar supply question, and the comparison is worth reading before you judge either coin on tokenomics alone.
Key Levels Traders Are Watching
Levels give a prediction its teeth, because they say where the forecast breaks. These are the lines traders watch on the INJ chart right now, based on recent price action and published technical reads.
| Level | Price | What it means |
|---|---|---|
| Nearest support | $7.80 | Holding here keeps the ETF rally intact |
| Next support | $6.98 | The November 2 low, where buyers stepped in |
| Nearest resistance | $8.30 | The November 6 high, tested twice |
| Next resistance | $8.69 to $9.00 | A break here opens the path to double digits |
| Psychological level | $10.00 | The round number bulls need to reclaim |
| All-time high | $52.75 | The March 2024 peak, about 6.5 times current price |
The 14-day relative strength index near 54 to 56 leaves room in both directions. It is not flashing overbought, so a push higher would not need a cooldown first, yet it is not oversold either, so a dip would not be a bargain by that measure alone.
Common Mistakes With INJ Predictions
The first mistake is reading the burn headline without the supply footnote. A 7.27 million burn sounds large, but supply grew from 100 million to about 122.9 million over the same era, so net supply rose, not fell.
The second mistake is treating one ETF as a flood. The Canary fund holds $16.12 million after two sessions, which is real money, yet it is a small fraction of INJ’s $810 million market value.
Flows matter more than the launch headline.
The third mistake is copying a 2030 target without checking the market value behind it. A $59 average needs a $5.89 billion market value, above the all-time-high market value, and any forecast should survive that simple test.
The fourth mistake is ignoring Bitcoin. INJ can outrun Bitcoin for a week on its own news, as it did after the ETF launch, but it rarely escapes a broad market slide.
Our Monero price prediction makes the same point for a very different coin, because the rule applies to nearly every altcoin.
Frequently Asked Questions
These are the questions readers ask most about Injective and its price outlook. Each answer uses the same numbers and forecasts from the sections above.
What is the Injective price prediction for 2026?
Published forecasts put INJ between about $6.50 and about $11.58 by the end of 2026, with averages clustering near $8 to $9.65. Our base case puts INJ near $9 by year end, with a bull case near $11.50 and a bear case near $6.50.
Can Injective reach $50 again?
Yes, it can, but it needs a market value near $5 billion, just below the record market value near $5.3 billion from March 2024. Only CoinPedia’s optimistic 2030 view, at $58.90, clears that bar, and it assumes strong adoption plus a full market recovery.
Is Injective a good investment in 2026?
Injective has a real product, a live ETF, and a burn mechanism, but it also has a small ecosystem, token issuance near 4.40 percent a year, and heavy competition from larger trading chains. That mix makes it a high-risk, high-upside coin, and anyone considering it should only risk money they can afford to lose.
What is the highest Injective could go by 2030?
Published forecasts for 2030 run from a $10.98 average at PrimeXBT to a $58.90 average at CoinPedia, with highs up to about $74 in the most optimistic view. Our bull case sits near $35, and our base case sits near $16.
Why did Injective rise in November 2026?
INJ rose about 12.7 percent in the week to November 9, 2026, after Canary Capital’s staked INJ ETF started trading on Nasdaq on November 5 and gathered $16.12 million in net assets in its first two sessions. The rally also followed a broader bounce from the November 2 low near $6.98.
Where can I buy Injective (INJ)?
You can buy INJ on major exchanges such as Binance, Coinbase, Kraken, Bybit, and OKX. You can also buy it through the Canary staked INJ ETF on Nasdaq if you prefer a regulated fund over holding the token directly.
The Bottom Line
Injective finally has a catalyst that matches its pitch. A staked ETF now trades on Nasdaq, the token is up about 93 percent in six months, and the burn mechanism gives holders a real link between network revenue and supply.
But the honest forecast is a wide one. Our base case puts INJ near $16 by 2030, with a bull case near $35 and a bear case near $7, and the published forecasts disagree by more than five times on the same year.
The smartest way to read any INJ prediction is to run the market-value test from this article. Multiply the target by 100 million, compare it with the $5.3 billion record market value, and ask whether that number looks real.
If it does, the forecast deserves a second look.
This article is for information only, and it is not financial advice. Prices can move fast, forecasts can be wrong, and you should do your own research before making any investment decision.
On the storage side of the same decentralised-infrastructure trade, our Filecoin price prediction puts FIL near $3.00 by 2030 after the Solstice upgrade cut new supply by 75%.