



The bitcoin price held above $84,000 on Tuesday while gold suffered its worst day since June. That split tells the story of the entire quarter: Bitcoin is up more than 40% since July while the yellow metal just got crushed by surging bond yields.
Now a closely watched chart pattern has put $100,000 back on the table. Jurrien Timmer, director of global macro at Fidelity Investments, says Bitcoin’s break above $80,000 confirms a double-bottom formation that points toward six figures.

Key Takeaways
- Gold fell nearly 4% on Monday, its biggest drop since June, as the US 10-year Treasury yield climbed past 5.2%, its highest since 2007. Bitcoin slipped just 1% and bounced back above $84,000.
- Bitcoin is up more than 40% this quarter, leaving gold, the S&P 500, and every other major asset far behind, according to CoinDesk.
- Fidelity’s Jurrien Timmer says Bitcoin’s move above $80,000 confirms a double-bottom pattern with a $100,000 target, and options traders agree: the $90,000, $95,000, and $100,000 calls hold the most open interest on Deribit.
- The risks are real: markets price a greater than 70% chance of a Fed rate hike in October, and chart patterns fail all the time. Tomorrow’s PCE inflation report and Friday’s payrolls data are the next catalysts.
What Happened on September 29
Gold bore the brunt of investors’ rate-hike fears on Monday. The metal fell almost 4% to a seven-week low of $4,114 an ounce, its largest percentage decline since June, before steadying near $4,150 on Tuesday, according to Dow Jones Newswires.
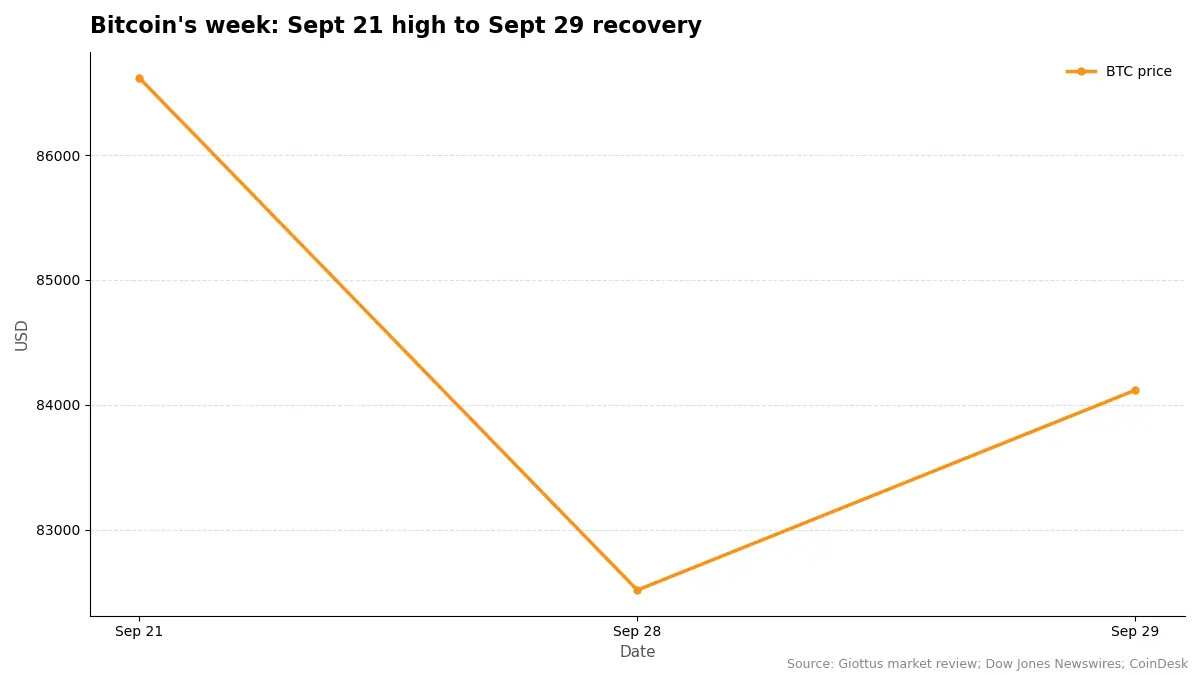
Bitcoin barely flinched by comparison. It slipped about 1% on Monday, briefly touching $82,516, then recovered to trade around $84,100 to $84,300 on Tuesday. CoinDesk’s market data put it at $84,170, up 0.82% since midnight UTC.
The pressure is coming from the wider financial market. The US 10-year Treasury yield has climbed above 5.2%, while the two-year yield is approaching 5%. Markets are now pricing in more than a 70% chance of another Federal Reserve rate hike in October. Brent crude sits near $106 a barrel, keeping inflation fears alive. The dollar index has risen 2.7%, from 98.78 to nearly 101.50, since September 9.
CoinSwitch’s markets desk sees $84,000 as the key hurdle for the bitcoin price, with $82,000 as near-term support. Analyst Vikram Subburaj of Giottus puts immediate support at $82,000 to $83,000, a stronger zone at $80,000 to $82,000, and resistance at $85,000 to $85,800, followed by $87,000 to $87,400.
Why the Bitcoin Price Is Leaving Gold Behind
Rising yields are supposed to hurt every asset that pays no interest, and that includes both gold and Bitcoin. So why is only one of them falling?

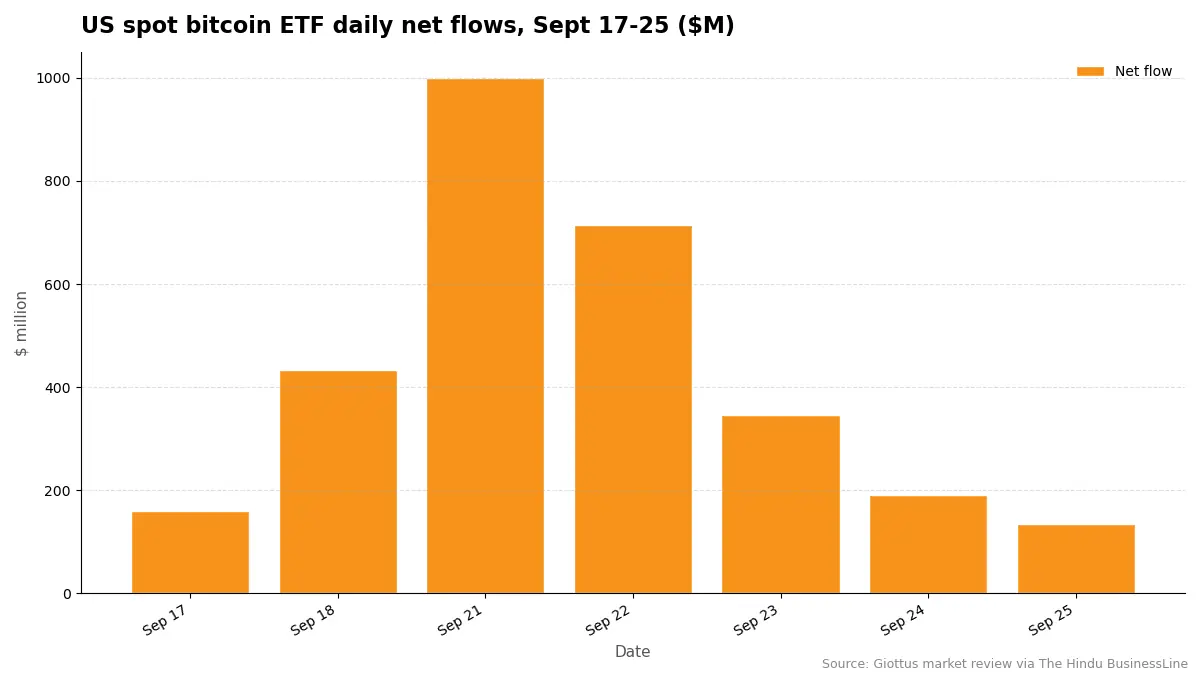
The honest answer is that Bitcoin has demand engines gold does not. US spot Bitcoin ETFs pulled in roughly $2.98 billion of net inflows between September 17 and September 25, including single-day hauls of $999 million on September 21 and $714.7 million on September 22, per Giottus market data. September 25 marked the seventh straight day of inflows, led by BlackRock’s IBIT.
Corporate buyers are adding to the bid. Strategy, Michael Saylor’s Bitcoin treasury company, disclosed Monday that it bought another 1,665 BTC last week at an average price of $85,681, a $142.7 million purchase. It was the company’s second weekly buy in a row, following a $396.7 million acquisition the week before.
That steady institutional demand is why US spot Bitcoin ETFs have been soaking up demand even as macro headlines turn ugly. It is also why the longer view looks so different from a single red day: Bitcoin looked historically oversold against gold earlier this year, and the snapback since has been violent. For the bigger picture on how the two assets compare as long-term holdings, see our full Bitcoin vs gold store-of-value comparison.
The $100,000 Setup: What a Double Bottom Means
A double bottom looks like the letter W on a price chart. The price drops to a low, bounces, falls back to roughly the same level, then rises again. The two dips show buyers stepping in at the same price twice. The peak in the middle of the W acts as resistance, and a break above it suggests sellers have run out of steam.
Bitcoin has now printed that W. The two lows came at $60,033 in February and $57,742 in late June, with the middle peak near $82,800. The break above $80,000 is what triggered the bullish call.
Jurrien Timmer’s Call
Jurrien Timmer, Fidelity’s director of global macro, laid out the case on X on Friday, September 25: “Bitcoin is looking particularly interesting here as it challenges key resistance at $80k. If it breaks it will confirm a double bottom targeting $100K.”
“Bitcoin is looking particularly interesting here as it challenges key resistance at $80k. If it breaks it will confirm a double bottom targeting $100K”
Jurrien Timmer (@TimmerFidelity) · Sep 25, 2026 · View on X
Timmer’s weekly chart, built on data through September 20, draws the neckline at about $80,554. Using textbook measurement, the depth from the $57,742 trough to the neckline implies an objective near $103,000, with $100,000 as the conservative first target, according to reporting by news.bitcoin.com. Timmer added that he is sensing “a new four-year cycle bull market is underway,” a sharp reversal from December, when he had warned 2026 could be Bitcoin’s “year off.”
One caution from CoinDesk’s own coverage: chart patterns are not guarantees. Breakouts often fail, reversing quickly and trapping buyers who chased the move.
What Options Traders Are Betting
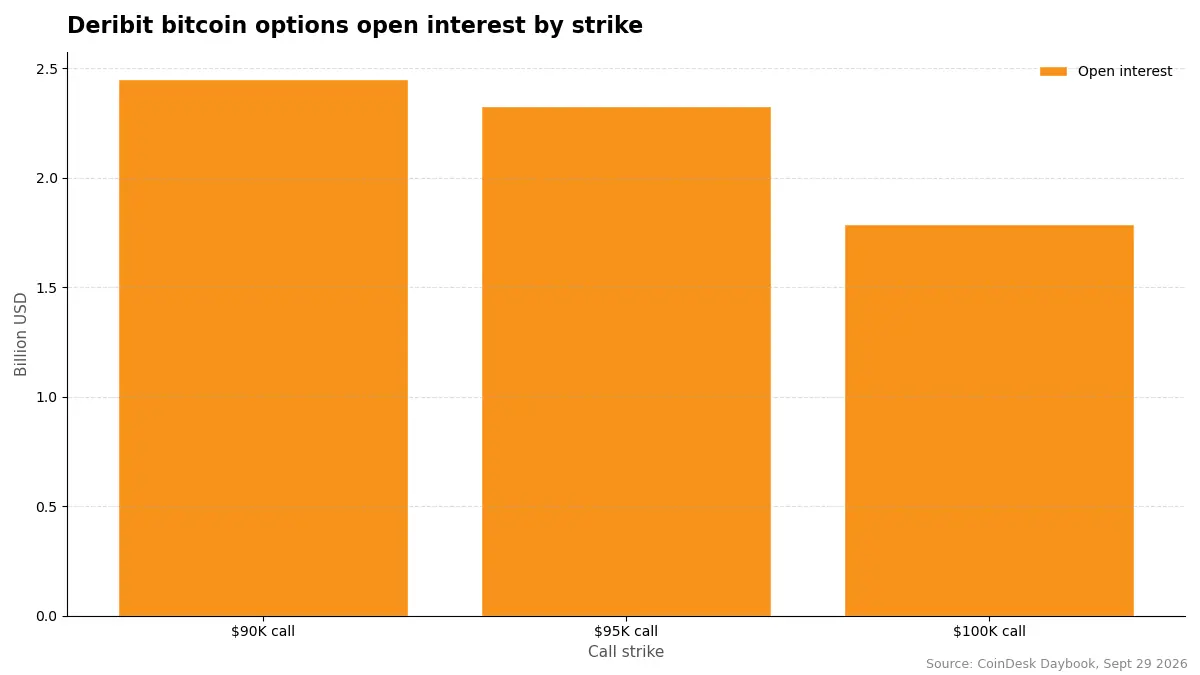
The derivatives market is positioned for more upside. On Deribit, the $90,000 call is the most popular Bitcoin options bet, with $2.45 billion in open interest. The $95,000 call follows with $2.33 billion, and the $100,000 call holds $1.79 billion. A call gives the buyer the right to buy at a set price and profits when the market rises above it.
That positioning fits the broader trend: Bitcoin dominance has been climbing as capital concentrates in BTC, and Bitcoin’s earlier run at $100,000 showed how fast the price can move once momentum builds. But CoinDesk also warns that options positioning can flip quickly when trends change.
The Honest Risks: Why $100K Is Not Guaranteed
A good news story tells you where it can break. Here are the cracks in the bullish case.
First, the macro setup is genuinely hostile. The Federal Reserve already raised rates earlier in September, and markets see a greater than 70% chance of another hike in October. Bitfinex analysts noted this week that the bitcoin price will need strong spot demand to push toward and past $87,000, and that demand “has yet to be seen.”
Second, the data calendar is loaded. The September 30 PCE inflation report and the October 2 payrolls numbers are the next major catalysts, and a hot reading on either could send yields even higher.
Third, prediction markets are far less excited than chart watchers. Kalshi traders give Bitcoin only a 39% chance of topping $100,000 in 2026. And as CoinDesk’s Daybook notes, double-bottom breakouts fail regularly enough that chasing them burns traders.
The balanced read: the technical setup is real, the institutional bid is real, and the macro headwind is equally real. For help thinking through timing in this kind of market, read our guide on whether now is a good time to buy Bitcoin.
Note: this article is news reporting and educational content, not financial advice. Bitcoin is volatile and you can lose money. Only invest what you can afford to lose.
What to Watch Next
September 30: PCE inflation report
A hot reading could push yields higher and pressure both gold and Bitcoin. A cool reading could ease rate-hike bets.
October 2: US payrolls data
Strong jobs data keeps the Fed hawkish. Weak data could revive hopes that the hiking cycle is done.
October: Fed meeting
Markets price a greater than 70% chance of another hike. Any surprise in either direction will move crypto fast.
Key price levels
Support at $82,000, then $80,000. Resistance at $84,000 to $85,800, then $87,400. A clean break above $87,500 opens the path toward the $90,000 options wall. For the full October map, see our Bitcoin price prediction for October 2026, which lays out every key level to watch.
Frequently Asked Questions
Why is Bitcoin outperforming gold right now?
Rising Treasury yields are hurting gold, which competes with bonds as a safe haven. Bitcoin is holding up because it has its own demand: US spot ETFs absorbed about $2.98 billion in nine sessions, and corporate treasuries like Strategy keep buying. Bitcoin is also up more than 40% this quarter, so momentum is on its side.
What is a double-bottom breakout?
It is a chart pattern shaped like the letter W. The price hits a low twice, bounces both times, then breaks above the middle peak. Technicians read it as a sign that sellers are exhausted. Fidelity’s Jurrien Timmer says Bitcoin’s two 2026 lows ($60,033 and $57,742) formed this pattern, and the break above $80,000 targets $100,000.
Will Bitcoin reach $100,000 in 2026?
Nobody knows. The technical setup points there, and options traders are betting on $90,000 to $100,000 strikes. But prediction markets give it only a 39% chance, chart patterns fail often, and the Fed may keep raising rates. Treat $100,000 as a scenario, not a promise.
Should I buy Bitcoin now that it is beating gold?
That depends on your goals, risk tolerance, and time horizon, not on a single day’s headlines. If you are new, start by learning what Bitcoin actually is, then read our guide on whether now is a good time to buy Bitcoin before deciding.
The Bottom Line
September 29, 2026 may be remembered as the day Bitcoin stopped acting like “digital gold” and started acting like the stronger asset. Gold fell nearly 4% on the worst bond-market day in years. Bitcoin dipped 1% and bounced.
The double-bottom breakout gives bulls a clean story toward $100,000, backed by real ETF flows, real corporate buying, and real options positioning. The Fed, the data calendar, and the market’s own habit of humiliating chart patterns give bears plenty of ammunition too.
Watch the $84,000 hurdle, watch tomorrow’s inflation data, and do not mistake a pattern for a promise.