



Bitcoin slides below 82k on Monday night and into Tuesday morning, and leveraged long traders paid the price. BTC closed near $81,988 after a 24 hour slide of about 2.1%, with a high near $84,265 and a low near $80,943.
The drop did not come from one bad headline. Traders cut risk ahead of the US September CPI report on October 14, and forced selling then pushed the price down faster.

Key takeaways
- Bitcoin fell below $82,000 and closed near $81,988, down about 2.1% in 24 hours.
- Crypto liquidations hit about $771 million in 24 hours, and longs made up about $685.6 million of that total.
- US spot Bitcoin ETFs lost about $681 million last week, their worst week since late June.
- September CPI lands on October 14 at 8:30 AM ET, and forecasters expect headline inflation near 3.6% to 3.7%.
- Traders watch support near $81,818 and resistance near $84,217 to $84,281.
What Happened as Bitcoin Fell Below $82,000
Bitcoin traded near $84,200 earlier in the day before sellers took control. The price then slid step by step and broke under $82,000 on Monday evening US time.
- What Happened as Bitcoin Fell Below $82,000
- Why Long Liquidations Made the Fall Worse
- ETF Outflows Removed a Key Source of Support
- The CPI Report on October 14 Is the Next Big Test
- Levels Traders Watch After the Slide
- Common Mistakes Traders Make After a Liquidation Drop
- Frequently Asked Questions
- Why did Bitcoin fall below $82,000?
- How much was liquidated in the drop?
- When does the September CPI report come out?
- How much did Bitcoin ETFs lose last week?
- What price levels matter most now?
- Conclusion
Other big coins fell harder in the same move. Ether dropped about 4.6% to near $2,425, and Solana and XRP also posted sharp losses.
The price numbers in one place
Market data shows a 24 hour range of about $3,323, from $84,265 at the top to $80,943 at the bottom. That wide range tells you traders sold fast and buyers stepped in late.
Prediction market traders cut their bets in real time too. Polymarket odds for Bitcoin above $82,000 on October 13 fell to about 53%, down from 68.5% a few hours earlier.
Why Long Liquidations Made the Fall Worse
A liquidation happens when an exchange closes a leveraged trade because the trader runs out of margin. A closed long becomes a forced sell order, and that sell order pushes the price down again.

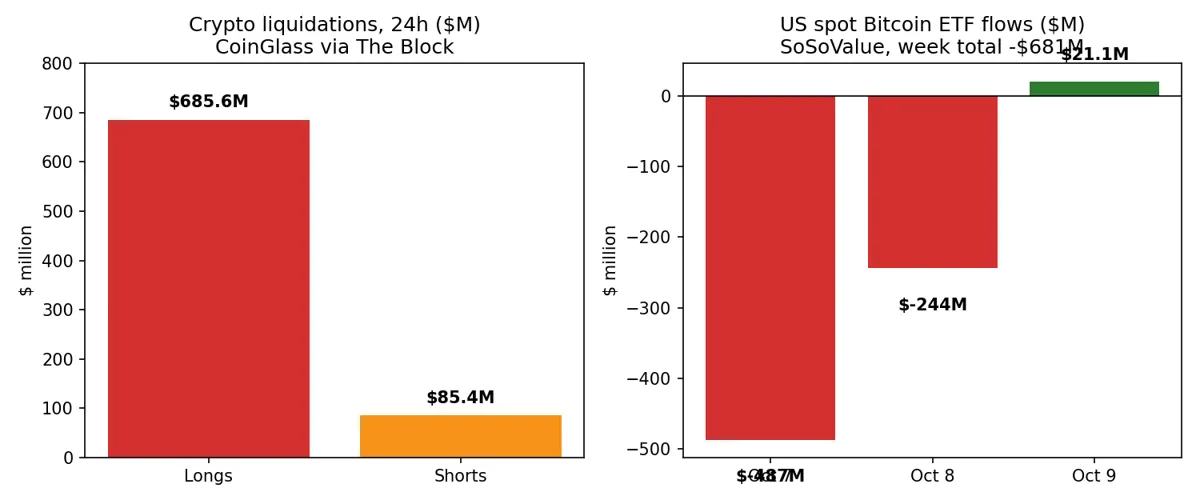
CoinGlass data put total crypto liquidations near $771 million in 24 hours. Longs made up about $685.6 million of that total, so buyers who bet on higher prices took almost all the pain.

Why this move looks like a leverage flush
Analysts described the pullback as a mix of macro worry, weak fund flows, and risk cutting before inflation data. Nobody pointed to one crypto scandal or one exchange failure as the cause.
You can read the same pattern in our earlier report on how Fed rate hike fears move Bitcoin. Rates and yields set the mood first, and leverage then turns a mood swing into a sharp drop.
ETF Outflows Removed a Key Source of Support
US spot Bitcoin ETFs posted about $681 million in net outflows from October 5 to October 9. SoSoValue data shows that week was the worst for the funds since late June.
The heaviest selling came midweek. Outflows reached about $487 million on October 7 and about $244 million on October 8, before a small $21.1 million inflow on October 9.
That flow picture matters because ETF buyers often cushion dips. Our coverage of Bitcoin ETFs opening October with inflows shows how fast that support can flip from buying to selling.
The flip also ends a three week run of ETF inflows. You can compare it with the stronger period in our report on September Bitcoin ETF inflows, when big money kept buying instead of leaving.
Ether ETFs lost about $542 million in the same week. Broad outflows across Bitcoin, Ether, and Solana funds point to investors cutting crypto risk as a group, not rotating inside crypto.
The CPI Report on October 14 Is the Next Big Test
The US Bureau of Labor Statistics releases September CPI on Wednesday, October 14 at 8:30 AM ET. Traders treat this print as the last major inflation test before the Fed meets on October 27 and 28.
Forecasts put headline inflation near 3.6% to 3.7% year on year, up from 3.4% in August. Core inflation, which strips out food and energy, sits near 2.4% to 2.5% in most forecasts.
What a hot or cool print would mean
A hot print would likely lift Treasury yields and the dollar again. Higher yields make risk assets less attractive, and Bitcoin has traded like a rate sensitive asset all month.
A cool print would do the opposite and could ease pressure fast. Our preview of Bitcoin before the CPI print and the falling Fed hike odds explains why hike odds already dropped to near 19%.
The jobs data also shapes that bet. The weak payrolls story in our Bitcoin jobs report coverage cut hike fears, but a hot CPI number could bring those fears back in one morning.
Levels Traders Watch After the Slide
Short term levels now decide whether this drop stays a flush or turns into a deeper fall. Traders draw those levels from recent price action and common chart tools, so treat them as zones, not promises.
| Level | Price zone | Why it matters |
|---|---|---|
| First support | Near $81,818 | Buyers defended the low area near here during the slide. |
| Breakdown watch | Below $80,943 | A close below the 24 hour low would open talk of a test near $80,000. |
| First resistance | $84,217 to $84,281 | Sellers capped the last rally attempt in this zone. |
| Higher resistance | Near $87,000 | Bitcoin has failed at this level three times, as our report on Bitcoin getting rejected at $87,000 shows. |
Open interest in Bitcoin futures still sits above $50 billion in recent CoinGlass based reports. High open interest means many leveraged bets remain open, so the next CPI surprise can still trigger another fast move.
Common Mistakes Traders Make After a Liquidation Drop
The first mistake is treating a liquidation flush as a final verdict on Bitcoin. Forced selling ends when margin runs out, and prices often bounce once that selling stops.
The second mistake is adding leverage right after a flush. Volatility stays high after big liquidations, and one CPI headline can wipe out a fresh leveraged trade in minutes.
The third mistake is ignoring fund flows for a full week. One green ETF day means little after a $681 million outflow week, and our explainer on the longest streak of daily net outflows for US Bitcoin ETFs shows how long weak demand can last.
Frequently Asked Questions
Readers asked the same few questions all morning after the drop. The short answers below use only the verified numbers from this report.
Why did Bitcoin fall below $82,000?
Bitcoin fell below $82,000 because traders cut risk ahead of the October 14 CPI report, ETF outflows removed buying support, and forced long liquidations then pushed the price down faster.
How much was liquidated in the drop?
CoinGlass data put total crypto liquidations near $771 million in 24 hours, and long positions made up about $685.6 million of that total.
When does the September CPI report come out?
The September CPI report comes out on Wednesday, October 14 at 8:30 AM ET, and forecasts put headline inflation near 3.6% to 3.7% year on year.
How much did Bitcoin ETFs lose last week?
US spot Bitcoin ETFs lost about $681 million from October 5 to October 9, and the heaviest outflows came on October 7 near $487 million and October 8 near $244 million.
What price levels matter most now?
Traders watch support near $81,818 and resistance near $84,217 to $84,281, and a close below the $80,943 low would raise the risk of a test near $80,000.
Conclusion
Bitcoin slides below 82k because macro fear, weak ETF flows, and crowded long trades all hit at once. None of those three factors needs a crypto scandal to explain the move.
The CPI print on October 14 now decides the next leg. A cool number could spark a relief bounce, and a hot number could test the $80,000 zone again.