



The Bitcoin Fear and Greed Index is a daily mood score for the Bitcoin market, from 0 to 100. Low means fear. High means greed. That is the whole idea in one line, and this guide explains the rest in plain words.
On October 8, 2026, market reports put the index near 60, in the Greed band, while Bitcoin traded near $83,000. A day earlier, another widely tracked reading was 71, also Greed. The two numbers differ because providers use different methods, and that gap itself is your first lesson: never treat one score as exact truth.

If you are new, start with our complete guide to how Bitcoin works first. Then come back here. Knowing what Bitcoin is makes the mood score much easier to use well.
- Bitcoin Fear and Greed Index Explained in Simple Words
- What the 0 to 100 Score Actually Means
- How the Index Is Calculated, Part by Part
- Volatility: 25 percent
- Market momentum and volume: 25 percent
- Social media: 15 percent
- Surveys: 15 percent, currently paused
- Bitcoin dominance: 10 percent
- Google Trends: 10 percent
- Why the Index Matters, and Why It Does Not Predict Price
- 7 Simple Rules for Beginners Who Want to Use It Safely
- Common Misunderstandings That Trip People Up
- Myth: extreme fear always means buy now
- Myth: extreme greed always means sell everything
- Myth: all fear and greed scores should match
- Conclusion: Use the Mood, Do Not Obey It
- FAQs
Key takeaways
- The index runs from 0 to 100. Below 25 is extreme fear, above 75 is extreme greed.
- It blends price moves, trading volume, social posts, Bitcoin dominance, and search interest.
- It shows mood, not the next price. It cannot tell you when to buy or sell on its own.
- Different providers can show different scores on the same day. Check the trend, not just one number.
- The safest beginner use is as a warning light: slow down at extremes, and stick to a plan.
Bitcoin Fear and Greed Index Explained in Simple Words
Think of the index as a thermometer, but for feelings instead of heat. It does not measure the price of Bitcoin directly. It measures how people are behaving around that price.
When prices fall fast, people panic, search for bad news, and sell in a rush. That pushes the score down. When prices climb for weeks, people get bold, post more online, and chase quick gains. That pushes the score up.
Where did this idea come from?
The idea first became popular in stock markets. CNN built a fear and greed gauge for United States stocks using things like market momentum and demand for safe assets.
The crypto version came later. Alternative.me launched its Crypto Fear and Greed Index in February 2018, and it is now the version most sites copy or quote. Other providers, such as CoinMarketCap, now run their own versions with their own inputs.

A concrete example you can picture
Say Bitcoin drops 8 percent in two days. News feeds fill with warnings. Trading volume spikes because scared holders are selling. Search interest for terms like Bitcoin crash jumps. In that week, the index might fall from 55 to 28, moving from Neutral into Fear.
Now flip it. Say Bitcoin rises for three calm weeks and breaks a price level everyone was watching. Posts get louder, volume rises with buying, and searches for how to buy Bitcoin climb. The score might rise into the 70s. Same coin, very different crowd mood.
What the 0 to 100 Score Actually Means
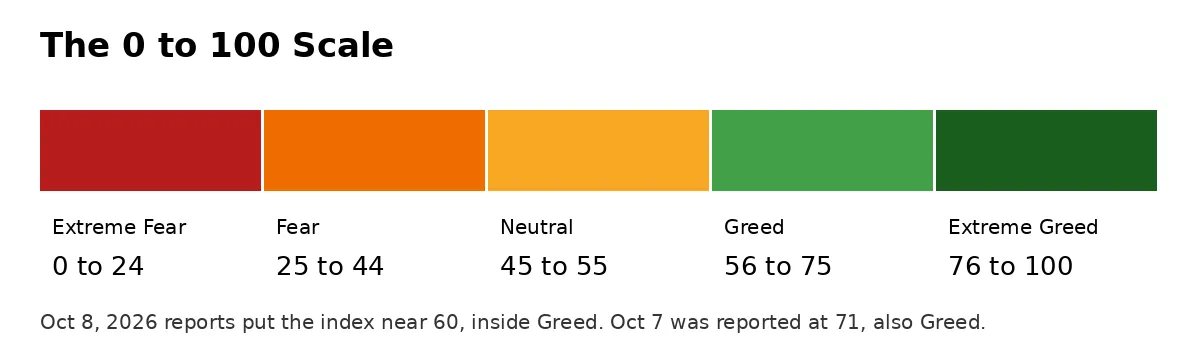
The scale is split into five bands. The exact cut points vary a little by provider, but the bands below are the ones most readers will see on the main dashboards.
Read the band first, and the exact number second. A move from 61 to 64 means little. A move from 48 to 78 in a week means the crowd mood has really changed.
| Score | Band | What it usually feels like |
|---|---|---|
| 0 to 24 | Extreme Fear | Panic selling, bad headlines, many people afraid to buy |
| 25 to 44 | Fear | Caution rules, buyers wait, sellers are still active |
| 45 to 55 | Neutral | No strong lean either way |
| 56 to 75 | Greed | Confidence is back, risk taking is rising |
| 76 to 100 | Extreme Greed | Euphoria, bold claims, late buyers rushing in |
The reading near 60 on October 8 sits in that Greed band, but well below extreme. In plain terms, traders were fairly confident after Bitcoin held above $80,000, even though the price had slipped from near $85,800 a few days earlier. If you want context on where price could go next, compare this mood reading with our Bitcoin price prediction for 2026, but keep the two tools separate. One is a mood gauge. The other is a price forecast. They are not the same thing.
How the Index Is Calculated, Part by Part
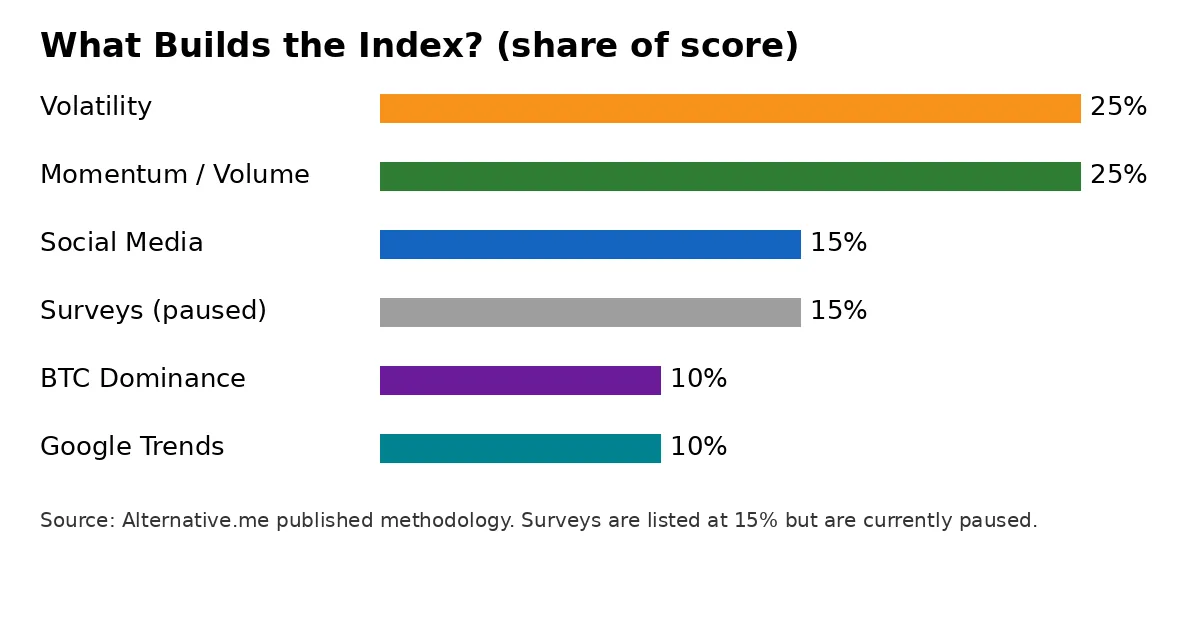
No single signal can capture a whole market mood, so the index blends several signals into one weighted score. The published method for the best known version lists six parts, and their weights add up to 100 percent.
Here is the honest catch. The full formula is not public. We know the parts and the weights, but not every detail of how each part is scored on a given day. That is why two honest providers can publish different numbers.
Volatility: 25 percent
This part compares current price swings and large drops with average swings over the past 30 and 90 days. Wild swings push the score toward fear, because sharp moves scare people.
Note the limit here. Volatility alone does not say why price moved. A fast rise can also be volatile. That is one reason the index needs the other parts.
Market momentum and volume: 25 percent
This part compares current trading volume and price momentum with recent averages. Strong buying volume in a rising market points toward greed. Weak volume or falling momentum pulls the score down.
Volume can rise for many reasons, though. It can come from spot buying, futures trades, or forced sales when leveraged bets fail. The index treats it as one clue, not a full story.
Social media: 15 percent
This part looks at how often Bitcoin is talked about online and how fast those posts spread. Loud, fast, excited talk tends to point toward greed. Quiet talk tends to point the other way.
Social buzz is easy to fake and easy to overread. A single viral post can spike talk for a day without changing real demand at all.
Surveys: 15 percent, currently paused
The method lists surveys of market users at 15 percent, but Alternative.me has paused that part. So the live score today rests more on the other five parts than the old list suggests.
This matters when you read old guides. Many still describe surveys as if they are active every week. They are not, at least in the best known version.
Bitcoin dominance: 10 percent
Dominance is Bitcoin share of the total crypto market value. On October 8, reports put it near 59 percent, which is high. When dominance rises, money is often moving into Bitcoin and out of smaller coins, which can be a defensive move, so it can point toward fear.
When dominance falls, traders are often taking more risk on smaller coins. That risk taking can point toward greed. To see the defensive side in action, read how past downturns played out in our guide to how low Bitcoin has gone in past bear markets.
Google Trends: 10 percent
This part tracks search interest for Bitcoin related terms. A jump in searches linked to buying can point toward greed. A jump in searches linked to crashes or fear can point the other way.
Search data shows attention, not action. Lots of people search during a panic and never trade at all.
Why the Index Matters, and Why It Does Not Predict Price
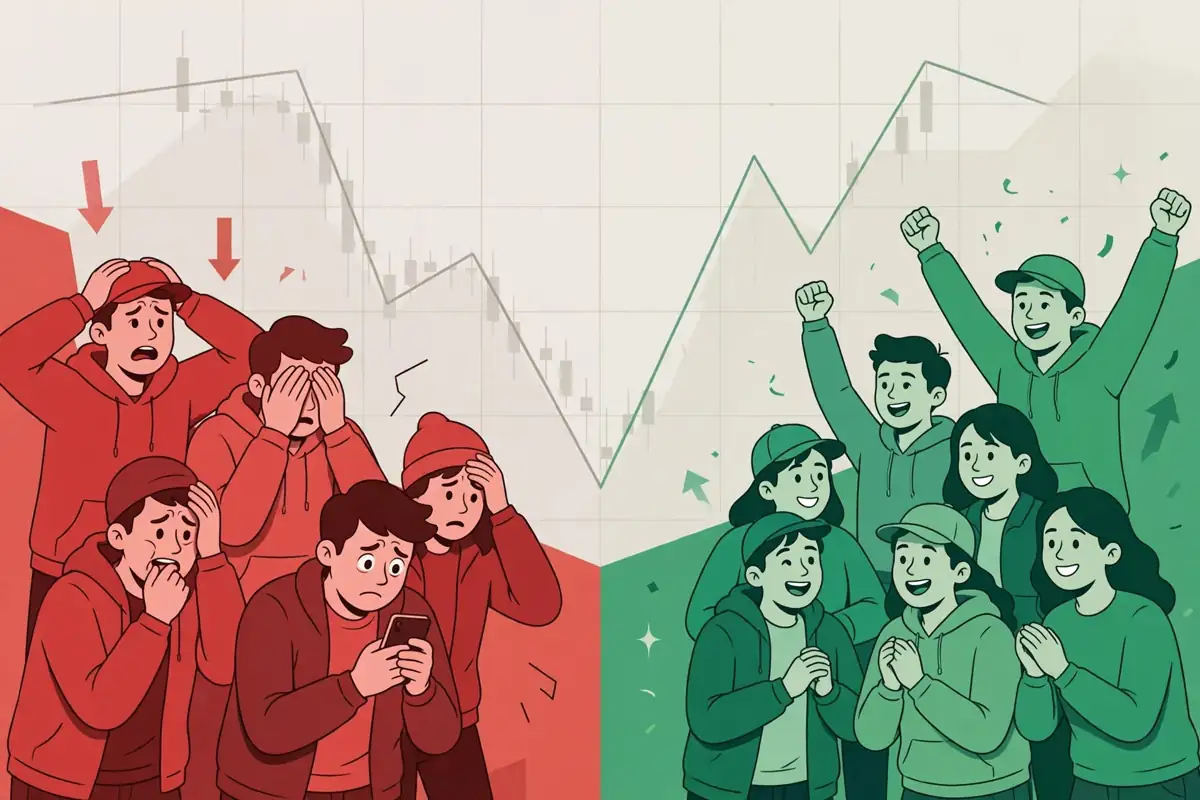
The index matters because crowds repeat the same mistakes. They buy boldly near tops, when good news feels endless. They sell in fear near bottoms, when bad news feels endless.
That pattern is why many traders use the index in a backward way. Extreme greed is a prompt to be careful. Extreme fear is a prompt to look closely, not a promise that price has bottomed.
The contrarian idea, in plain terms
You may have heard the famous advice to be fearful when others are greedy, and greedy when others are fearful. The index tries to put a number on that others part.
Used well, it slows you down. If the score is 82 and you feel a rush to buy more than planned, the number is telling you that rush is shared by the whole crowd. That is useful information, even if price keeps rising for weeks after.
This crowd effect is not just theory for holders. Our piece on the psychology of holding Bitcoin through wild swings shows how the same fear and greed cycle hits long term holders too.
What the index cannot do
It cannot value Bitcoin. It says nothing about adoption, regulation, or whether an exchange is safe. It cannot spot a hack, a policy change, or a large forced sale before it happens.
It also updates only once a day in its best known form, while Bitcoin trades all day and all night. Price can move 5 percent before the next daily score appears. And because it is built mostly around Bitcoin, it can describe a small altcoin you own very badly.
Fund flows add another layer the mood score can miss. For example, Bitcoin ETFs opening October with fresh inflows told a story about big buyers that a single sentiment number alone could not confirm or deny.
7 Simple Rules for Beginners Who Want to Use It Safely
You do not need a trading system to get value from this index. You need a few clear rules, written down before the market gets loud, and the discipline to follow them when it does.
These rules will not make you rich, and no honest guide should promise that. They are there to stop the two most common beginner errors: buying in a rush at extremes, and selling in panic at extremes.
Rules 1 to 3: read it right
Rule 1: check the trend over 7 to 30 days, not just today. A score falling from 78 to 60 tells a different story than a score rising from 42 to 60, even though both end at 60.
Rule 2: note which provider you used, and stick to that one for comparisons. Mixing scores from two methods creates fake moves that never happened.
Rule 3: treat extremes as questions, not orders. At 80 plus, ask what could go wrong. At 20 or below, ask whether the panic has a real cause you are missing.
Rules 4 to 7: act with a plan
Rule 4: decide your buy amounts in advance. Many beginners prefer dollar cost averaging Bitcoin with small fixed buys on a set schedule, so one scary or exciting reading cannot change the whole plan.
Rule 5: never use the index alone. Pair it with price levels you care about, your time frame, and basic news checks. If all three point the same way, your read is stronger.
Rule 6: size down at extremes, in either direction. If you still want to act when the score is extreme, a smaller amount limits the harm if the crowd keeps going without you, or against you.
Rule 7: write down what you did and why. A short note with the date, the score, and your reason will teach you more in three months than any chart will. You will see your own fear and greed pattern, and that is the one that costs you money.
Common Misunderstandings That Trip People Up
Most errors with this index come from reading too much into one number. The score feels precise, because it is a number, but the mood it tries to capture is messy and human.
Here are the misunderstandings I see most often, and the calmer way to think about each one.
Myth: extreme fear always means buy now
No. Extreme fear has often appeared during deep sell-offs, and some of those moments later looked like good entry points. But the score can stay in extreme fear for weeks while price keeps falling.
Think of it as a sign that risk is high and emotions are stretched, not as a green light. If you act, acting in small steps protects you if the fall continues.
Myth: extreme greed always means sell everything
Also no. Strong markets can stay greedy for a long time. Bitcoin spent many days in Greed in the past month, with a 30 day average near the high 60s in one tracked series, without a single extreme crash day.
Extreme greed is a reason to check your plan, take stock of gains, and avoid adding risk in a rush. It is not proof that a top is today.
Myth: all fear and greed scores should match
They will not, and that is normal. One provider may read 73 while another reads 55 on the same day, because they use different inputs, different time windows, and different math.
That gap reported in late September, 73 versus 55, is a good reminder. Pick one source for your daily check, learn how it behaves, and do not panic when another site shows a different label.
Conclusion: Use the Mood, Do Not Obey It
The Bitcoin Fear and Greed Index is a useful, simple mood gauge. It sums up volatility, momentum, volume, social talk, dominance, and search interest into one daily score from 0 to 100.
Your next step is small and practical. Pick one provider, check the score and its 30 day trend once a day for two weeks, and write down how it made you feel about buying or selling. That habit, more than any single reading near 60 or 71, is what turns this index from a headline into a tool that actually helps you.
FAQs
Here are short answers to the questions beginners ask most about this index.
What is the Bitcoin Fear and Greed Index?
It is a daily score from 0 to 100 that sums up the mood of the Bitcoin market. A low score shows fear, and a high score shows greed.
How is the Bitcoin Fear and Greed Index calculated?
The best known version blends six parts: volatility at 25 percent, market momentum and volume at 25 percent, social media at 15 percent, surveys at 15 percent, Bitcoin dominance at 10 percent, and Google Trends at 10 percent. The survey part is currently paused.
What does a reading of 60 mean?
A reading of 60 sits in the Greed band. It means traders are fairly confident and willing to take risk, but the market is not yet at the extreme level above 75.
Should I buy Bitcoin when the index shows extreme fear?
Not on that signal alone. Extreme fear has often appeared near hard sell-offs, but the score can stay low for weeks. Many beginners use a set plan, such as buying small fixed amounts over time, instead of trying to time one reading.
How often does the index update, and where can I check it?
The best known crypto version updates once a day. You can check it on Alternative.me and on major market dashboards, but note that different providers use different methods, so their scores can differ on the same day.