



Bitcoin wicked down to about $83,800 late on Tuesday, October 6, and that one move reopened the hardest question in crypto. The bitcoin bear market how low debate is back, because Bitcoin is now about 33% below its all time high near $126,198, set on October 6, 2025.
The short answer is this. History says a full bear market has taken Bitcoin down 77% to 93% in past cycles. This cycle is only about 33% down so far. If the old pattern repeats in a milder form, the math points to a possible bottom zone between about $38,000 and $63,000. If support near $82,000 to $83,000 holds, this may stay a deep correction, not a full bear market.

This article compares every major drawdown, shows the price math for each case, and maps the levels to watch next. It is analysis, not financial advice.
- The Live Trigger: A $555 Million Long Wipeout
- Bitcoin Bear Market How Low: What History Says
- The Math: What Each Deeper Fall Would Mean
- The Levels That Decide Which Case Wins
- Why This Cycle Could Be Shallower, and Why It Might Not
- Common Mistakes in a Bear Market
- FAQs
- Is Bitcoin in a bear market right now?
- How low could Bitcoin go in this bear market?
- What was the worst Bitcoin bear market in history?
- How long do Bitcoin bear markets usually last?
- What level would weaken the bear case?
- Conclusion
- Bitcoin traded near $84,100 on October 7, about 33% below the $126,198 high from October 6, 2025.
- CoinGlass data reported by The Block showed $555.6 million in liquidations in 24 hours, including $487.2 million in long positions.
- Past bear markets fell 93% in 2011, 86% in 2013 to 2015, 84% in 2017 to 2018, and 77% in 2021 to 2022.
- Each new bear market has been smaller than the last, which is why many analysts expect a shallower fall this time.
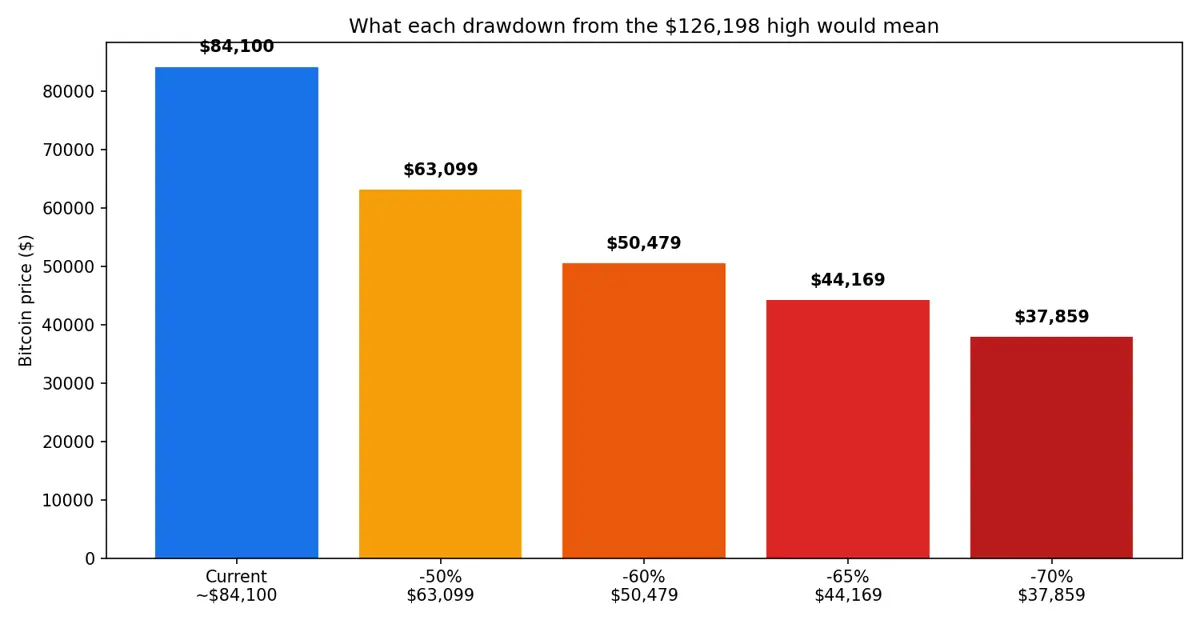
- The first line to defend is $82,000 to $83,000. Below that, the drawdown math opens the $63,000, $50,000 and $38,000 zones.
The Live Trigger: A $555 Million Long Wipeout
Bitcoin did not drift lower this week. It fell fast, after another failed push above $87,000. Our report on Bitcoin being rejected at $87,000 for the third time explains how that ceiling kept capping every rally.
When price slipped below $84,000, leveraged traders who had bet on higher prices were forced out. Those forced sales pushed price lower still, which is why a small drop turned into a cascade.
What the liquidation data shows
The Block, citing CoinGlass, reported $555.6 million in total liquidations over 24 hours, with $487.2 million of that in long positions. A separate report put about $403 million of long liquidations inside a single hour.
That mix matters. When most of the damage is in longs, the market was positioned for a rise that never came. Clearing that leverage can help price stabilize, but it does not prove the low is in.

Bitcoin Bear Market How Low: What History Says
A bear market is not just a bad week. Traders usually mean a long fall of 20% or more from a high, often lasting many months. By that simple test, Bitcoin is already in bear market territory at about 33% down.
The real question is depth. The table below uses widely reported peak and low prices for each cycle. Small differences exist between data providers, so treat the percentages as close estimates, not exact science.
Every major drawdown, side by side
| Cycle | Peak | Low | Fall |
|---|---|---|---|
| 2011 | About $32 | About $2 | About 93% |
| 2013 to 2015 | About $1,150 | About $170 | About 86% |
| 2017 to 2018 | About $19,700 | About $3,200 | About 84% |
| 2021 to 2022 | About $69,000 | About $15,500 | About 77% |
| 2025 to 2026 so far | About $126,198 | About $83,800 wick so far | About 33% |
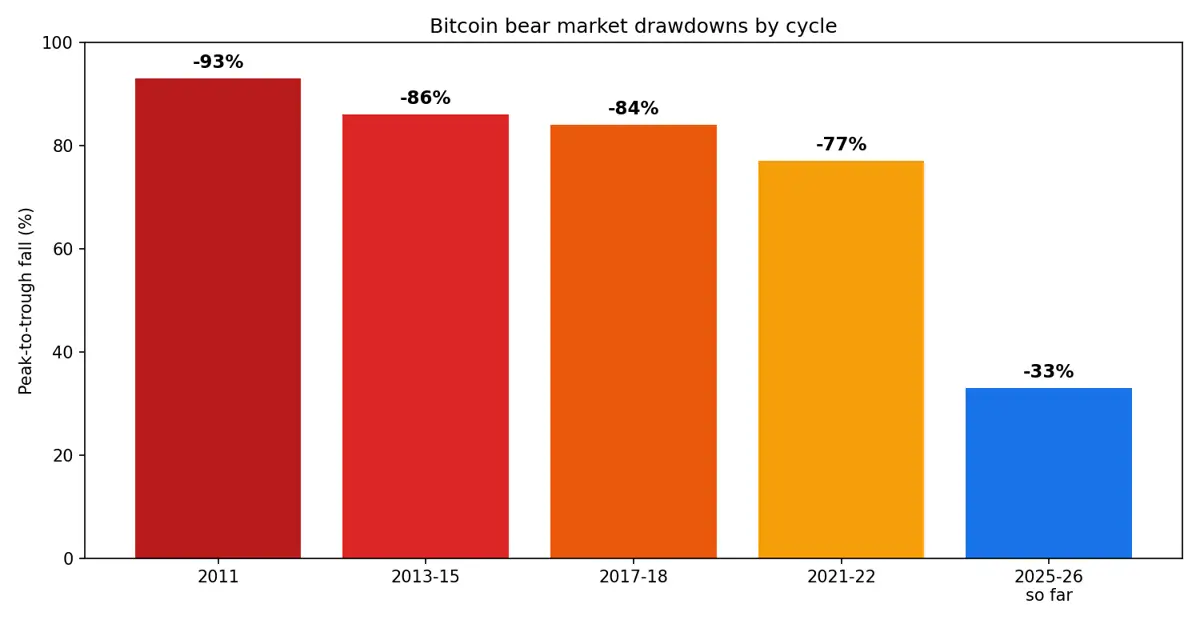
One pattern stands out. Each bear market has been less severe than the one before it. A bigger market, deeper liquidity and large institutional holders are the usual reasons given for that trend.
The Math: What Each Deeper Fall Would Mean
Percentages can feel abstract, so here is the same math in dollars. All of these levels are simple calculations from the $126,198 high. They are scenarios to plan around, not price targets promised by anyone.
If this cycle follows the shrinking pattern, a final fall of 50% to 70% is the range most historical comparisons point to. That is still a wide range, which is exactly why position sizing matters more than guessing the exact low.
Scenario levels from the all time high
| Case | Total fall | Price zone | What it would mean |
|---|---|---|---|
| Recovery case | About 33% (already seen) | $82,000 to $84,000 holds | A deep correction inside a wider uptrend, similar to the levels in our Bitcoin price prediction for October 2026 |
| Base case | 50% to 55% | About $57,000 to $63,000 | A normal, shallower bear market that fits the shrinking drawdown trend |
| Bear case | 60% to 70% | About $38,000 to $50,000 | A full repeat of past cycle pain, likely needing a bigger macro or industry shock |
For the longer view, compare these zones with our Bitcoin price prediction for 2026 and its year end targets. The two pieces use different time frames, so the levels will not match exactly, and that difference is the point.
The Levels That Decide Which Case Wins
History gives the range, but the chart gives the timing. Three zones matter most in the days ahead, and each one changes the story if it breaks.
Price action near support is more useful than any single forecast. A support zone that holds on a daily closing basis is very different from a brief wick below it during a liquidation spike, like the move to about $83,800.
Support and resistance to watch
- $83,300 to $84,600: the dense support zone buyers defended before the latest drop.
- $82,000 to $83,000: the next watched support area, named by ViaBTC analyst Jeff Ko in comments reported by The Block.
- $87,000 to $87,374: the ceiling that has rejected price three times. A daily close above it would weaken the bear case fast.
Macro news can move price between these zones quickly. Today’s Fed FOMC minutes coverage for Bitcoin traders explains why the next Federal Reserve signal matters for the $87,000 test.
Why This Cycle Could Be Shallower, and Why It Might Not
There are real reasons to expect a smaller fall this time. Spot Bitcoin ETFs, public company treasuries and a much larger market cap all add buyers who did not exist in 2018 or 2022.
There are also real risks. High interest rates, a 10 year Treasury yield near historic highs, and heavy leverage can all extend a fall. ETF buyers can also sell, and corporate buyers tend to slow down when price falls, as recent treasury reports have shown.
The halving cycle clock
Past cycle tops arrived roughly 12 to 18 months after each halving, and lows followed months later. The October 2025 high fits that rough timing, which is why cycle comparisons carry weight right now. Our guide to when the Bitcoin halving 2028 takes place shows the next supply cut that long term holders are already looking toward.
Still, a pattern is not a law. Each cycle has had its own trigger, from exchange failures to rate hikes, and this one will be judged on its own facts. Longer term forecasts in our Bitcoin price prediction for 2028 and the debate over whether Bitcoin can reach $200K both depend on whether this drawdown ends as a correction or a full bear market.
Common Mistakes in a Bear Market
Most losses in past bear markets did not come from the fall itself. They came from choices made during the fall, often under stress and time pressure.
Knowing the common errors in advance will not remove the stress, but it can stop a bad week from becoming a permanent loss.
Five errors to avoid
- Using heavy leverage near support. The $403 million one hour long wipeout shows how fast leveraged trades can be closed for you.
- Treating one wick as a confirmed breakdown. Wait for daily closes before calling a support zone lost.
- Assuming history must repeat exactly. Drawdowns have shrunk every cycle, so copying 2018 or 2022 percentages blindly can mislead.
- Ignoring the macro backdrop. Rate decisions and bond yields have driven several of the biggest moves this year.
- Going all in at the first low. Every past bear market had several false recoveries before the final low.
FAQs
Here are short, direct answers to the questions readers ask most about Bitcoin bear markets.
Is Bitcoin in a bear market right now?
By the common 20% rule, yes. Bitcoin is about 33% below its $126,198 high from October 6, 2025, which passes the usual bear market test, even though the final depth is not yet known.
How low could Bitcoin go in this bear market?
Based on past drawdowns of 77% to 93% and the trend toward smaller falls, a 50% to 70% total fall would put Bitcoin between about $38,000 and $63,000. If the $82,000 to $83,000 support holds, the low may already be much closer.
What was the worst Bitcoin bear market in history?
The 2011 bear market was the worst by percentage, with a fall of about 93%. Later bear markets fell about 86% in 2013 to 2015, 84% in 2017 to 2018, and 77% in 2021 to 2022.
How long do Bitcoin bear markets usually last?
Past bear markets have lasted roughly a year from peak to trough, though the exact length changes each cycle. The 2021 to 2022 fall took about 12 months from the November 2021 high to the November 2022 low.
What level would weaken the bear case?
A daily close above $87,000 to $87,374, the zone that has rejected Bitcoin three times, would weaken the bear case. Holding $82,000 to $83,000 on daily closes would also support the recovery case.
Conclusion
Bitcoin at about $84,100 is about 33% below its high, with a fresh $555.6 million liquidation wave showing how crowded the long side had become. History says full bear markets go much deeper, between 77% and 93%, but each one has been smaller than the last.
That gives an honest range, not a single number. Watch $82,000 to $83,000 first, then use the scenario table above: about $57,000 to $63,000 in the base case, and about $38,000 to $50,000 in the bear case. Your next step is simple: decide in advance what you would do at each level, before price gets there and emotions take over.