



Solana trades near $110 on October 9, 2026, down about 4% in a day and roughly 63% below its all time high of $295.90 from January 19, 2025. That gap is the whole debate. Bears see a broken cycle. Bulls see a top tier network on sale. This Solana price prediction 2030 guide cuts through both sides with numbers, not hype.
The short answer first. In our base case, SOL ends 2026 between $120 and $180, builds toward $240 to $360 by 2028, and reaches $335 to $500 by 2030. The bull case, backed by published bank research, goes far higher. The bear case keeps SOL under $150 for years. Below, we show what has to happen for each path, and the exact price levels that tell you which one is winning.

Key takeaways
- SOL trades near $110 with a market cap near $67.6 billion and about 588.7 million coins in circulation.
- US spot Solana ETFs took in a record $188.22 million in one recent week, then slowed to $2.43 million the next week, a drop of about 99%.
- Standard Chartered’s published path puts SOL at $250 at the end of 2026 and $2,000 by 2030. VanEck’s 2030 model spans $9.81 bear, $334.70 base, and $3,211.28 bull.
- Support sits near $100 and $95. Resistance sits near $120 to $123, then $140.
- Every forecast here is a scenario, not a promise. Nobody knows the 2030 price.
Solana Price Today: Where SOL Stands on October 9, 2026
Price context matters more than any single forecast. A coin that just fell hard needs a different read than one sitting at record highs. Solana right now is in repair mode after a sharp market wide selloff.
- Solana Price Today: Where SOL Stands on October 9, 2026
- Solana Price Prediction 2030: Bear, Base and Bull Cases by Year
- The ETF Factor: Record Week, Then a 99% Slowdown
- Network Adoption: Payments and Settlement Are the Real Test
- Key Support and Resistance Levels for SOL
- Risks That Could Break Any Solana Forecast
- FAQs
- Conclusion: The Level Headed Way to Read SOL to 2030
Bitcoin slid toward $81,000 on October 8 and total crypto liquidations passed $1 billion that day. SOL long liquidations made up most of its $15.4 million total, and SOL futures open interest fell about 5.29% to $6.93 billion. In plain words, leveraged traders got flushed out. Spot holders were not facing a Solana specific failure.
The numbers that frame every forecast
SOL changes hands near $110.49 to $110.68 across major trackers today. The 24 hour range ran from about $105.71 to $115.34. Over 30 days SOL is still up about 11%, even after losing about 7.6% in the past week. Trading volume sits near $5 billion a day, so this is still one of the most liquid coins in the market.
That liquidity cuts both ways. Deep markets recover faster when buyers return, but they also let big sellers exit fast. Readers comparing long term altcoin paths often start with our XRP price prediction for 2026 to 2030, which shows how much ETF approval hopes alone can move a forecast range.
Solana Price Prediction 2030: Bear, Base and Bull Cases by Year
One number for 2030 is useless. A range with clear assumptions is honest. The table below blends published research from Standard Chartered, VanEck, and several forecast trackers, then weights it against today’s price action and ETF flows. Treat the columns as three different futures, not three guesses at one future.

Our base case assumes Solana keeps its place as a leading smart contract network, ETF inflows stay positive across most quarters, and stablecoin and payment use keeps growing at a steady pace. It does not assume Solana beats every rival or that crypto avoids another deep bear market.
| Year | Bear case | Base case | Bull case |
|---|---|---|---|
| 2026 | $65 to $95 | $120 to $180 | $250 |
| 2027 | $70 to $125 | $180 to $260 | $400 |
| 2028 | $90 to $170 | $240 to $360 | $700 |
| 2029 | $100 to $220 | $320 to $480 | $1,200 |
| 2030 | $150 to $280 | $335 to $500 | $2,000 to $3,211 |
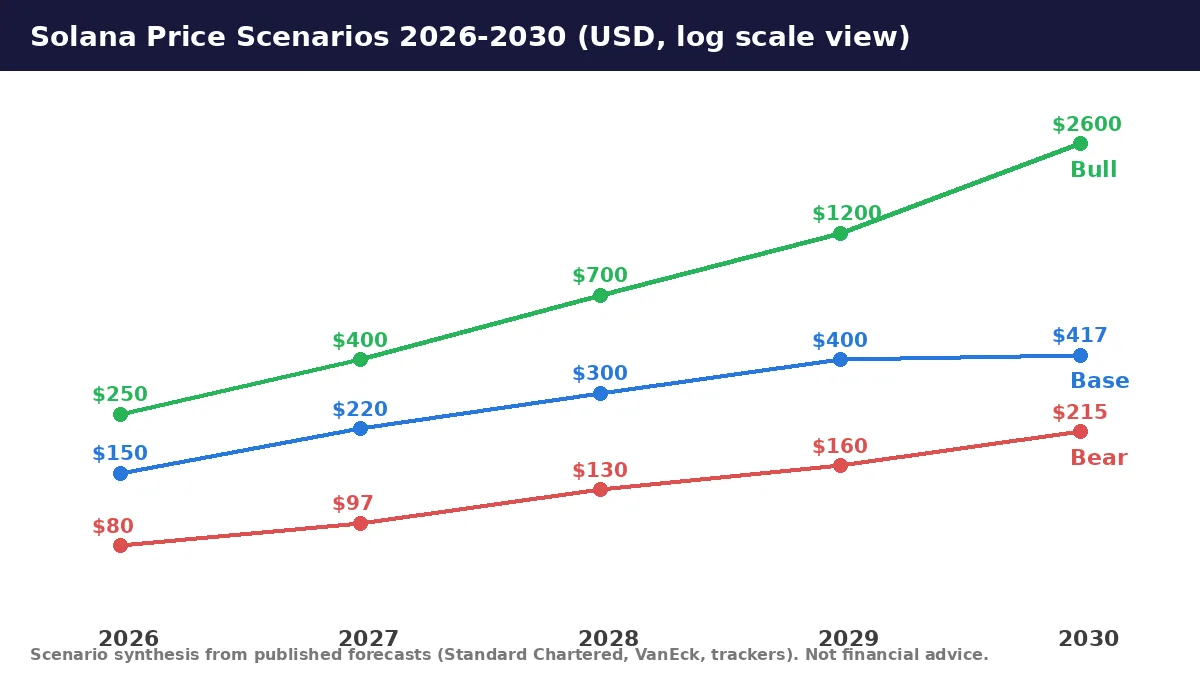
The bull column leans on published research, not our imagination. Standard Chartered cut its end of 2026 target to $250 in February 2026, down from $310, while lifting later years to $400 for 2027, $700 for 2028, $1,200 for 2029, and $2,000 for 2030. VanEck’s older 2030 model is wider still, with a $3,211.28 bull case built on Solana taking a very large share of the smart contract market.
Why the bear case cannot be ignored
VanEck’s bear case for 2030 is $9.81. That sounds extreme, and it is meant to be. It models a future where Solana wins almost no lasting market share and network revenue stays tiny. A softer bear path, where Solana survives but slowly loses ground to rivals, is the $150 to $280 zone in our table. Either way, the lesson is the same: today’s $110 price already assumes a lot of future success.
History backs that warning. Our Ethereum price prediction to 2030 shows the same pattern for ETH, where long range models spread from cautious to wildly bullish depending on one thing, real fee paying demand.
The ETF Factor: Record Week, Then a 99% Slowdown
Spot ETFs changed who buys SOL. Fund buyers do not chase memecoins at midnight. They allocate on schedules, and their flow data is public. That makes ETF demand one of the cleanest signals in this whole forecast.
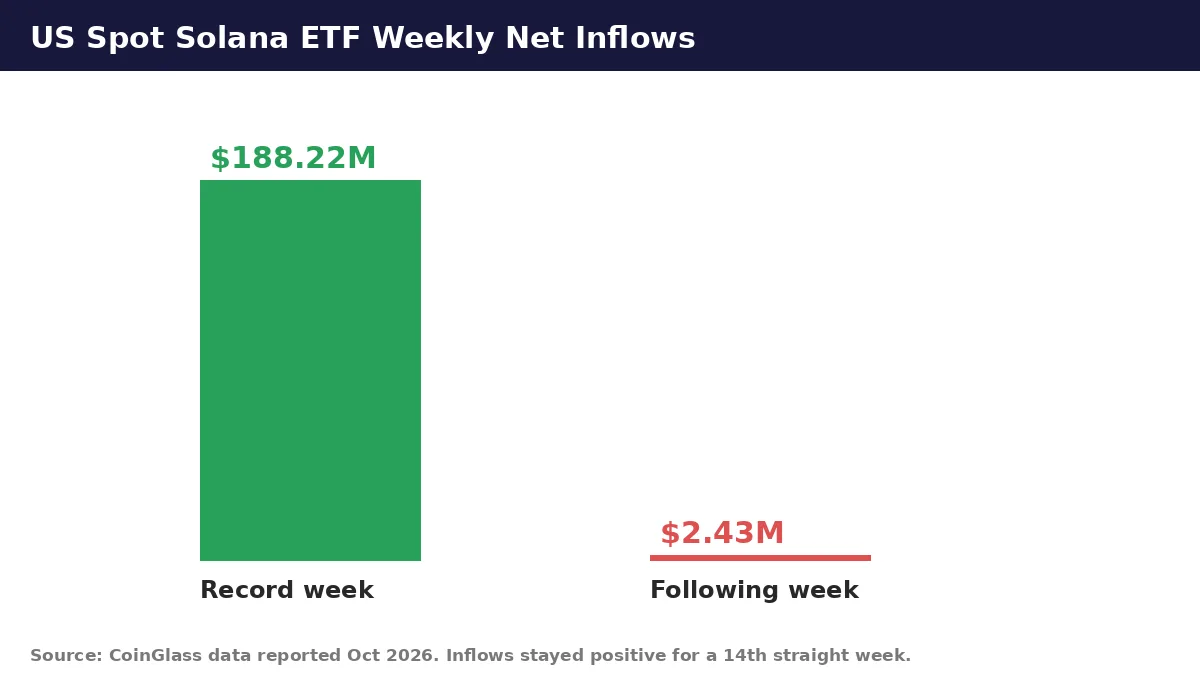
The signal right now is mixed, and honest analysis has to say so. Solana ETFs pulled in a record $188.22 million in one week, with about 68% of one big Friday going into the Bitwise staking fund BSOL, which passes a net staking yield of about 5.31% to holders. Cumulative net inflows have reached about $1.52 billion, with combined net assets near $1.81 billion.
What the flow slowdown really means
Then the pace collapsed. The following week brought only $2.43 million of net inflows on CoinGlass data, a fall of about 98.7% from the record week. Weekly inflows still stayed positive for a 14th straight week, so this was a pause in new buying, not an exit. Front loaded demand after a product launch often fades like this.
For the base case to hold, flows do not need record weeks every week. They need to stay positive across most quarters so funds keep buying the dips that retail panic creates. The same flow logic drives Bitcoin, as our report on the record $2.39 billion Bitcoin ETF week showed when one strong week reset price expectations across the market.
Staking yield is Solana’s quiet edge here. A Bitcoin ETF pays nothing. A staking SOL fund pays holders while they wait. In a world where cash yields sit above 5%, that difference decides real allocation meetings, not just crypto Twitter debates.
Network Adoption: Payments and Settlement Are the Real Test
Price follows use, with a lag. Solana’s strongest adoption news this month was not a price headline at all. It was distribution, the slow kind that compounds.
On October 7, Solana announced a partnership with Samsung to support native USDC cross border transfers through Samsung Wallet, set to start in the last week of October and reach about 82 million US Galaxy devices. A day earlier, the Solana Foundation’s DvP initiative launched an open source tool for atomic delivery versus payment settlement, built with institutional input that included JPMorgan.
Why settlement matters more than hype cycles
Standard Chartered’s thesis rests on exactly this shift, Solana rotating away from memecoin flow toward stablecoin and micropayment settlement. Memecoin volume spikes fees for a month, then vanishes. Payment rails, once wired into wallets people already carry, tend to stay.
That said, adoption claims need the same skepticism as price targets. The Samsung service has not launched yet. DvP is a tool, not a signed wave of bank volume. Watch live stablecoin transfer volume on Solana over the next two quarters. If it climbs while price stalls, the base case gets stronger. If it fades, the bear case does.
For a sense of how adoption math scales to the market leader, see our Bitcoin price prediction for 2030, where the same settlement and treasury demand arguments produce a far wider model spread.
Key Support and Resistance Levels for SOL
Long term cases still have to survive short term charts. Levels do not predict the future, but they show where buyers and sellers have actually fought, and where the next fight likely starts.
On the downside, $100 is the big psychological line. Lose it on a daily close and the next zones are $95, then $85 to $90, an area several conservative 2026 forecasts treat as the likely floor. Holding $100 through this selloff would be a real show of strength given that Bitcoin itself is testing the low $80,000s.
The levels that confirm or break the base case
On the upside, $120 to $123 capped rallies when SOL traded near $120 earlier this month, with the 50 period average near $119 also acting as a lid. A daily close above $123 opens $140, then $180, the top of our 2026 base range. The all time high at $295.90 is the final boss, and no honest 2026 case should promise it.
Traders who want the Bitcoin side of this same level based method can read our Bitcoin price prediction for 2026, which maps the $74,000 floor against the $150,000 dream using the same bear, base and bull frame.
Risks That Could Break Any Solana Forecast
Every model above can fail, and not only in the bearish direction. Listing the risks plainly is part of the analysis, not a disclaimer pasted at the end.
The first risk is simple market beta. SOL fell this week because Bitcoin fell. If Bitcoin loses the $80,000 area, altcoins with high beta like Solana usually fall faster, whatever their own news says. The second risk is competition. Ethereum keeps the deepest institutional tooling, and newer fast chains keep chasing Solana’s speed claim. The third is execution: network upgrades and outage free operation have to hold for years, not quarters.
The honest limits of price prediction
There is also model risk. VanEck’s 2030 spread, from $9.81 to $3,211.28, is a 327 times gap between bear and bull. When experts disagree by that much, the correct takeaway is not to pick the middle and relax. It is to size positions for the bear column and treat the bull column as a bonus. Our guide to Bitcoin vs Ethereum for beginners makes the same point for new investors: understand what you own before you forecast what it might be worth.
None of this is financial advice. It is a map of published forecasts, live flow data, and chart levels, checked on October 9, 2026. Prices and flows can change fast, and they will.
FAQs
Q: What is the Solana price prediction 2030 in the base case?
A: In the base case in this article, SOL trades between $335 and $500 by 2030. That case assumes Solana stays a top tier smart contract network, ETF inflows stay positive over time, and payment and stablecoin use keeps growing.
Q: Can Solana reach $1,000 by 2030?
A: It is possible in a strong bull case, but it is not the base case here. Published bull paths go much higher, including Standard Chartered at $2,000 for 2030 and VanEck at $3,211.28 in its bull case. Both need very large market share and revenue growth.
Q: Why did Solana fall in October 2026?
A: Solana fell with the wider market in early October 2026. Bitcoin dropped toward $81,000, total crypto liquidations passed $1 billion on October 8, and SOL futures open interest fell. The drop was a market wide risk off move, not a Solana network failure.
Q: What price levels matter most for SOL right now?
A: Support sits near $100, then $95 and the $85 to $90 zone. Resistance sits near $120 to $123, then $140 and $180. A daily close above $123 would improve the short term picture. A loss of $95 would weaken it.
Q: Is Solana a good buy at $110?
A: Nobody can answer that for you. At near $110, SOL is about 63% below its January 2025 high, so the risk and the possible reward are both large. Size any position so a deep drop does not break your plan, and never invest money you need soon.
Conclusion: The Level Headed Way to Read SOL to 2030
Solana at $110 sits between two stories. The data supports both for now: record ETF weeks and real payment partnerships on one side, a 99% flow slowdown and a market wide selloff on the other. Our base case, $335 to $500 by 2030, needs steady progress, not miracles. The bull case needs Solana to become core settlement infrastructure. The bear case needs only drift.
Your next step is simple. Watch the $100 support and the weekly ETF flow number. Those two data points, updated every week, will tell you which column of the table is winning long before 2030 arrives.