



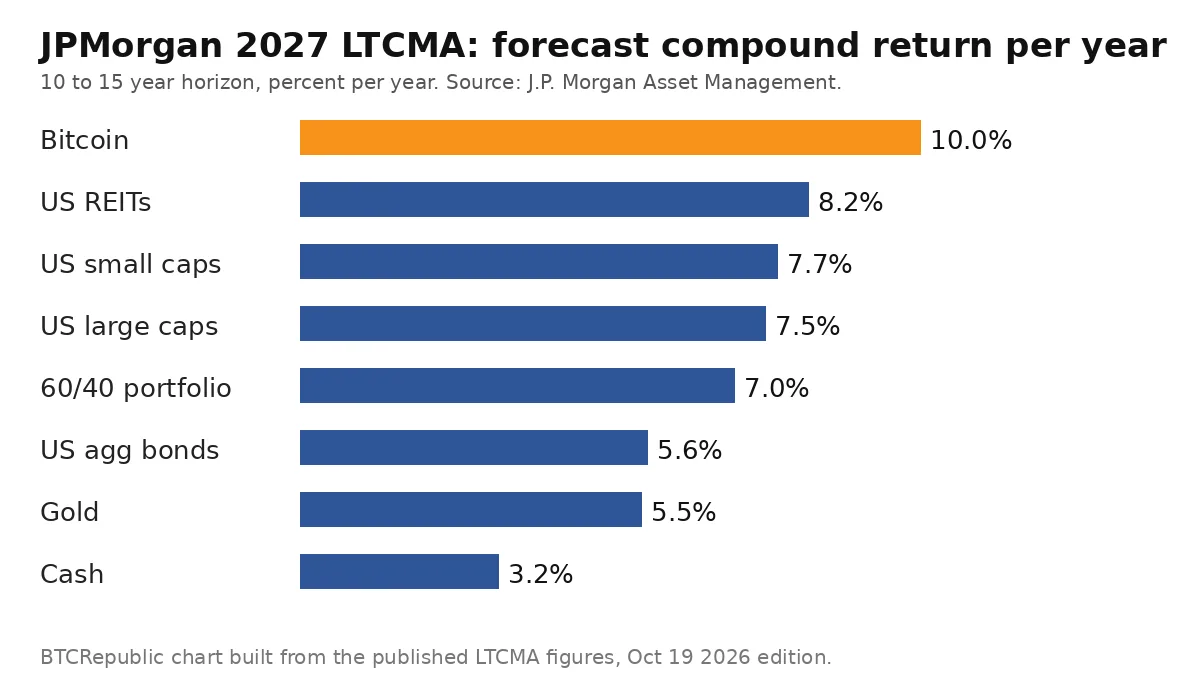
JPMorgan has put Bitcoin at the top of its long term return table for the first time. Its 2027 Long-Term Capital Market Assumptions give Bitcoin a base case of 10.0 percent a year, compounded, over the next 10 to 15 years.
That number beats every stock, bond and gold forecast in the same report. The catch sits right next to it, because the bank still keeps Bitcoin out of its core portfolio models.

Key takeaways
- The 2027 LTCMA is the 31st edition of the report, published on October 19, 2026. It is the first edition ever to include Bitcoin.
- Base case is 10.0 percent a year compounded. The published range runs from a loss of 9.7 percent a year to a gain of 17 percent a year.
- The arithmetic average return is 20.9 percent a year. Assumed volatility is 55 percent a year, about three times the level for gold.
- Bitcoin tops the table ahead of US REITs at 8.2 percent, US large caps at 7.5 percent and gold at 5.5 percent.
- JPMorgan does not put Bitcoin in its main covariance matrices. It sits in a separate, smaller matrix only.
What JPMorgan actually published
The LTCMA is not a price call for next month. It is a planning document that sets return, risk and correlation guesses for more than 200 asset classes over a 10 to 15 year window.
- What JPMorgan actually published
- The full table puts Bitcoin first, with a warning attached
- Our own price math, worked from this morning’s price
- Why a 20.9 percent average becomes a 10 percent compound return
- The real story is the exclusion from core models
- How the market backdrop looked the same week
- Common mistakes readers make with this headline
- FAQs
- What return does JPMorgan forecast for Bitcoin?
- Is the JPMorgan Bitcoin 10 year forecast a price target?
- Why did JPMorgan keep Bitcoin out of its core portfolio models?
- Why is the arithmetic return 20.9 percent but the compound return only 10 percent?
- Did JPMorgan recommend that investors buy Bitcoin?
- Conclusion
Banks and pension funds use documents like this to decide long term mixes. That is why a first entry for Bitcoin matters more than a normal analyst note, and our guide to what Bitcoin is and how it works covers the basics for new readers.
A first entry after 30 editions without one
The report language is careful and short. JPMorgan says it has put a range on Bitcoin returns for the first time, but Bitcoin is not included as an allocation.
Portfolio manager Sheena Shah and digital asset strategist Dennis Cristallo frame the asset in the report comments. They describe it as speculative and as a possible hedge against money supply growth, not as a steady diversifier.
The three building blocks behind the 10 percent
Coverage of the report describes a three factor method. The biggest weight, 65 percent, tracks Bitcoin supply growth against US and global money supply growth.

A second factor, weighted at 30 percent, treats Bitcoin as a partial complement to gold. Network adoption gets a 5 percent weight and pulls the result down, which is one reason the final base case lands at 10.0 percent rather than higher.
The full table puts Bitcoin first, with a warning attached
On compound return alone, Bitcoin wins the table by a clear gap. US REITs come next at 8.2 percent, then US small caps at 7.7 percent and US large caps at 7.5 percent.
A classic 60/40 stock and bond mix sits at 7.0 percent. US aggregate bonds sit near 5.6 percent, gold at 5.5 percent and cash at 3.2 percent.
| Asset | Forecast return per year | Assumed volatility |
|---|---|---|
| Bitcoin | 10.0% | 55.0% |
| US REITs | 8.2% | 17.3% |
| US small caps | 7.7% | 21.0% |
| US large caps | 7.5% | 18.0% |
| 60/40 portfolio | 7.0% | Not stated here |
| US aggregate bonds | 5.6% | 4.7% |
| Gold | 5.5% | 17.2% |
| US cash | 3.2% | 0.7% |
Readers should note one honest detail before they share the headline. Some published summaries of the underlying model scenarios put the bear case at minus 11.2 percent and the bull case at 16.6 percent, while the headline range is reported as minus 9.7 percent to plus 17 percent.
Those edges differ because they come from different layers of the same work. We use the headline range in the math below, and we label every result as an illustration, not as a JPMorgan price target.
Our own price math, worked from this morning’s price
No short news brief on this story did the dollar math in full. So we did it here, using a simple formula that any reader can check on a phone calculator.
Bitcoin traded near 82,964 dollars early on October 21, 2026. The formula is starting price times one plus the yearly rate, raised to the power of the number of years.
What each case means in dollars over 10 years
| Case | Rate per year | Growth factor, 10 years | Illustrative level from $82,964 |
|---|---|---|---|
| Bear | Minus 9.7% | 0.36x | About $29,900 |
| Base | 10.0% | 2.59x | About $215,200 |
| Bull | 17.0% | 4.81x | About $398,800 |
Run the base case for 15 years instead of 10 and the factor rises to about 4.18x. That points to roughly 346,600 dollars, again as pure arithmetic on JPMorgan’s rate.
These levels are not predictions by BTCRepublic and they are not targets JPMorgan published. They only show what a steady yearly rate would do, and real Bitcoin prices never move in a steady line.
For a wider set of views, see our comparison of whether Bitcoin will reach $200K in bull and bear cases and our Bitcoin price prediction for 2030 with models compared.
Return per unit of risk tells a colder story
Divide the return by the volatility and the ranking flips. Bitcoin gives about 0.18 units of return for each unit of volatility in this table.
Gold gives about 0.32 on the same rough maths, and US large caps give about 0.42. US REITs give about 0.47, which means the top raw return also carries the weakest pay for its risk in this group.

Why a 20.9 percent average becomes a 10 percent compound return
This gap confuses many readers, and it is the most useful lesson in the report. An arithmetic average adds up each year’s result and divides by the number of years.
A compound return tracks what a real holder keeps after gains and losses stack on each other. Big drops hurt more than big gains help, because a 50 percent loss needs a 100 percent gain just to get back to even.
Volatility drag, in plain words
Traders call that gap volatility drag. With volatility near 55 percent, the drag is huge, so a 20.9 percent simple average shrinks to a 10.0 percent compound result.
Gold shows a much smaller gap because its volatility sits near 17 percent. The smoother the ride, the closer the average and the compound result stay to each other.
The real story is the exclusion from core models
A forecast is not an allocation. JPMorgan left Bitcoin out of its main covariance matrices, the tables its models use to judge how assets move together.
Instead, the bank built a separate, smaller matrix. That matrix sets Bitcoin against 12 core dollar assets, from cash and bonds to gold and hedge funds.
What covariance means, in one plain paragraph
Covariance measures whether two assets tend to rise and fall together or move apart. Pension models need stable answers to that question, because a mix only lowers risk if its parts do not all fall at the same time.
JPMorgan says Bitcoin correlations jump around too much for that job today. In its separate matrix, Bitcoin correlation sits at 0.33 with US large caps and 0.10 with gold, but the bank does not yet trust those links to hold in a crisis.
What could change the decision
The report points to three doors. Lower volatility would help, steadier correlations would help, and better regulation, liquidity and price discovery would help.
The bank also pushes back on one popular bull claim. It calls the idea that currency debasement will send a rush of money into crypto wide of the mark, which you can test against our look at whether Bitcoin will reach $1 million and the math behind that case.
How the market backdrop looked the same week
Demand through regulated funds turned up on the same Monday the report landed. US spot Bitcoin ETFs took in about 526.6 million dollars net, their best day in about a month, based on SoSoValue data.
BlackRock’s IBIT alone took in 665.2 million dollars, its biggest day in about a year. Fidelity’s FBTC lost 83.6 million dollars and Grayscale’s GBTC lost 54.9 million dollars, so one fund drove the whole result.
Our explainer on Bitcoin ETF approval and what it means for investors and our tracker of Bitcoin ETF inflows in October give that flow more context.
A quiet rival returning more than 5 percent
The 10 year US Treasury yield held above 5 percent that week. That gives investors a government backed return with far less daily swing than Bitcoin.
Bitwise chief investment officer Matt Hougan still welcomed the report in an October 20 post on X. He wrote that first they ignore you, then they laugh at you, then they fight you, then they add you to their Long-Term Capital Markets Assumptions paper and predict you will be the best performing asset of the next decade.
Hougan also argued that the 55 percent volatility guess looks too high, which would make the return guess too low. Readers should weigh that view with care, because Bitwise sells crypto funds and has a business interest in wider adoption.
Common mistakes readers make with this headline
The first mistake is to read 10 percent a year as a promise. It is a planning assumption built from models, and the same document prints a bear case where a holder loses money for a decade.
The second mistake is to treat the forecast as a product recommendation. JPMorgan did not add Bitcoin to its model allocations, and it did not tell clients what share of a portfolio to hold.
The third mistake is to quote the 20.9 percent figure as the expected growth rate. That number is a simple average, and the compound figure of 10.0 percent is the one that describes long term growth.
FAQs
Readers asked the same five questions again and again after this report landed. Short answers sit below, in plain words.
What return does JPMorgan forecast for Bitcoin?
JPMorgan forecasts a base case compound return of 10.0 percent a year for Bitcoin over 10 to 15 years. The published range runs from a loss of 9.7 percent a year to a gain of 17 percent a year.
Is the JPMorgan Bitcoin 10 year forecast a price target?
No, the JPMorgan Bitcoin 10 year forecast is not a price target. It is a long term return assumption for planning, and any dollar level worked from it is an illustration of the maths, not a target the bank published.
Why did JPMorgan keep Bitcoin out of its core portfolio models?
JPMorgan kept Bitcoin out of its main covariance matrices because of its high volatility and unstable correlations with other assets. Bitcoin appears only in a separate, smaller matrix against a subset of assets.
Why is the arithmetic return 20.9 percent but the compound return only 10 percent?
The arithmetic return is a simple average of yearly results, while the compound return shows what a holder keeps after gains and losses stack up. High volatility drags the compound result far below the simple average.
Did JPMorgan recommend that investors buy Bitcoin?
No, JPMorgan did not recommend that investors buy Bitcoin. The report adds a return range for the asset but does not include Bitcoin as an allocation in its model portfolios.
Conclusion
JPMorgan has done two things at once. It has ranked Bitcoin first for long term return, and it has kept Bitcoin outside the machinery that builds its core portfolios.
Both halves matter for a serious reader. Watch future editions for one change above all, a move into the main covariance matrices, because that step would turn a forecast into real portfolio weight.
Until then, treat the 10 percent figure as a sign of acceptance with a clear limit attached.