



Key Takeaways
- Fidelity’s Jurrien Timmer declared a new cyclical bull market on September 26, with his power-law model pointing to $300,000 by 2029.
- Bitcoin never broke $60,000 during the long slump. Timmer calls that level the “line in the sand.”
- His Bitcoin-to-gold indicator turned positive at 6% after bottoming near -100%, a pattern seen before past bull runs.
- Near term: a clean break above $82,500 could open a technical path to $100,000.
- The risk: the 10-year Treasury yield hit 5.24%, its highest since 2007, which pressures risk assets.
Fidelity’s global macro chief Jurrien Timmer says Bitcoin’s bear market is over. On September 26, the Wall Street veteran declared that “a new cyclical bull market is underway” for Bitcoin after it held $60,000, and his power-law model points to $300,000 by 2029. Bitcoin now trades near $84,700, holding above $80,000 for more than two weeks.
What Timmer Actually Said
Jurrien Timmer is the director of global macro at Fidelity Investments, one of the largest asset managers in the United States. He shared his updated view in a post on X on September 26, along with charts built from Fidelity, Bloomberg, and Haver Analytics data.

His exact words: “Bitcoin’s power law math continues to suggest that a new cyclical bull market is underway after holding $60k, targeting $300k in 2029.” The $300,000 target sits more than 3.5 times above Bitcoin’s current price and far above its 2025 all-time high of about $126,198.
- Key Takeaways
- What Timmer Actually Said
- Why $60,000 Is the “Line in the Sand”
- The Gold Signal Just Flashed Green
- A Sharp Reversal From His August View
- The Near-Term Roadmap: $82,500, Then $100,000
- What Could Break the Call
- Frequently Asked Questions
- Who is Jurrien Timmer?
- What is Bitcoin’s power law?
- Why is $60,000 so important?
- Is $300,000 by 2029 Fidelity’s official prediction?
- What is the $82,500 level?
- The Bottom Line
One important note: this is Timmer’s personal view as a macro analyst. It is not Fidelity Investments’ official forecast, and it is not investment advice.
Why $60,000 Is the “Line in the Sand”
Timmer’s whole call rests on one level: $60,000. Bitcoin fell toward it during the long slump but never broke below it. For a model that treats that floor as a law of the cycle, holding it means the bull market is back on.
On his chart, the power-law support line stood at $81,218 as of September 20, already below the market price at the time. Bitcoin has since pushed higher, trading near $84,700 at the start of October.
The Double Bottom That Caught Wall Street’s Eye
Bitcoin printed two local lows in the same zone: $60,033 in February and $57,742 in late June. Traders call this shape a double bottom. It usually signals that sellers are running out of force.

Timmer tied this pattern to a near-term target too. He wrote that Bitcoin challenging $80,000, which it has now cleared, would confirm the double bottom and point toward $100,000.
What the Power Law Actually Means
The power law is a simple idea: Bitcoin’s price follows a smooth upward curve when you plot it on a logarithmic scale. Short-term swings look noisy, but they bounce around that curve.
Timmer also tracks how far Bitcoin drifts from the curve using a Z-score, which is just a measure of distance from the average. When the price sits far below the curve, the model says Bitcoin is cheap for its age. Right now, the math says it has room to run.
The Gold Signal Just Flashed Green
The second pillar of the call is Bitcoin’s relationship with gold. Timmer’s Bitcoin-to-gold indicator has turned positive at 6% after bottoming near -100%. In past cycles, troughs of -120%, -118%, and -102% each marked the area where a new bull phase began.
Institutions are increasingly treating Bitcoin and gold as one macro trade, Bitwise noted in a recent report. That fits Timmer’s math: when the indicator turns up from deep lows, history says the cycle is turning too.

This pairing has been building for months. We covered Bitcoin’s recent outperformance of gold as yields spiked, and a sovereign wealth fund that sold gold to buy Bitcoin, both signs that big money treats the two as cousins.
A Sharp Reversal From His August View
What makes this call matter is how much Timmer’s tone changed. In August, he said Bitcoin had held the floor of its power-law curve and the correction had lasted long enough to count as a mild four-year winter. He stopped there. He did not declare a bull market, and he gave no price target.
His September 26 post removes that caution. It is also a long way from December, when he warned the market could drop toward $65,000 to $75,000. Bitcoin fell even further than that, then rebuilt from the $60,000 zone. The new call says the rebuild is done. For context, see our earlier piece on Fidelity’s view that Bitcoin was entering a new accumulation phase.
The Near-Term Roadmap: $82,500, Then $100,000
The long-term target is 2029, but traders are watching a much closer level. Timmer’s charts and independent analysts both point to $82,500 as the breakout trigger. A clean daily close above it would confirm the double bottom and open the technical path to $100,000.
Bitcoin has been stuck below $87,000 for over two weeks, with $82,500 acting as the floor of that range. It now sits right on the neckline, near $84,700. Our October 2026 outlook zoomed in on the $84,800 level that decides the month.
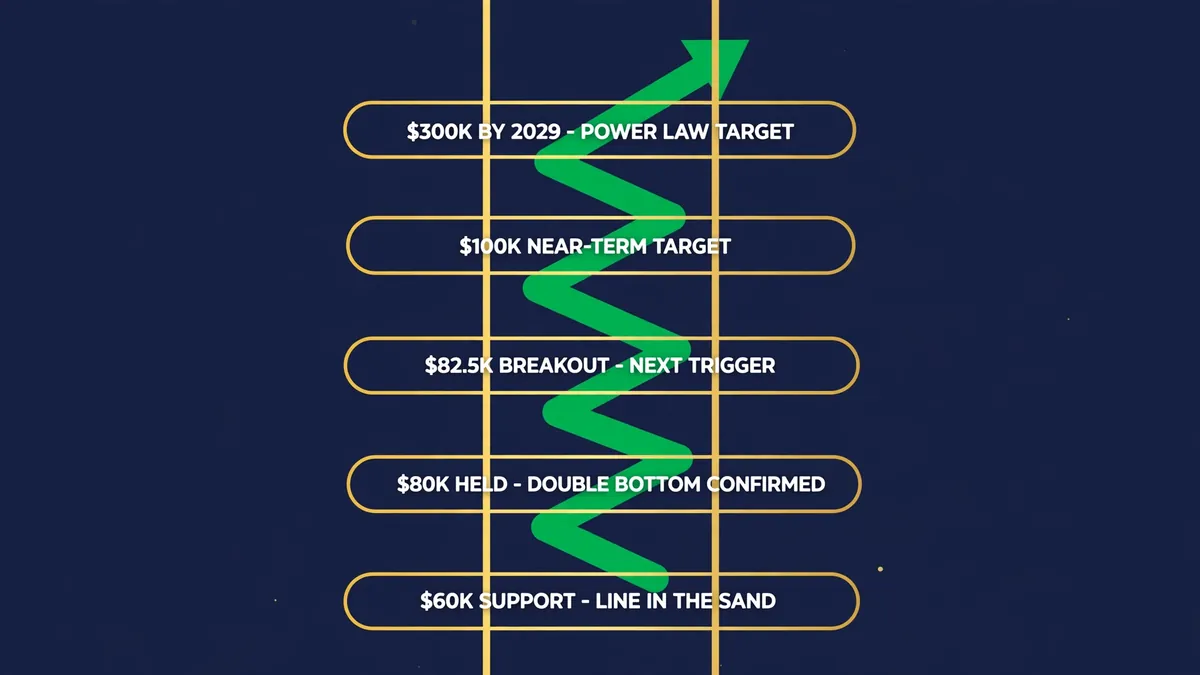
The Key Levels to Watch
| Level | Why It Matters |
|---|---|
| $60,000 | “Line in the sand.” Never broken during the slump. |
| $80,000 | Held for 2+ weeks. Confirmed the double bottom. |
| $82,500 | Breakout trigger toward $100,000. |
| $100,000 | Near-term technical target. |
| $300,000 | Power-law model target for 2029. |
What Could Break the Call
No forecast is a sure thing, and this one has real headwinds. The U.S. 10-year Treasury yield reached 5.24% on September 28, its highest level since 2007. High yields make safe government bonds more attractive and put pressure on risky assets like Bitcoin.
Timmer’s own model also comes with a condition: it assumes capital keeps moving from traditional assets into Bitcoin. If adoption stalls, the math breaks. Other Wall Street desks aim lower too. Compare it with Citi’s $113K target, our comparison of expert forecasts through 2028, and the year-end 2026 targets. Even futures data that echoed the 2022 bottom only confirmed the floor, not the ceiling.
Frequently Asked Questions
Who is Jurrien Timmer?
He is the director of global macro at Fidelity Investments. He has covered Bitcoin for years using quantitative models like the power law, and Wall Street watches his charts closely.
What is Bitcoin’s power law?
It is a model that fits Bitcoin’s long-term price to a rising curve on a logarithmic scale. The idea is that Bitcoin grows in predictable cycles around that curve instead of moving randomly.
Why is $60,000 so important?
Timmer calls it the “line in the sand” because Bitcoin fell toward it during the long correction but never broke below it. Holding that floor is what flipped his call from cautious to bullish.
Is $300,000 by 2029 Fidelity’s official prediction?
No. It is Timmer’s personal view based on his own power-law model. Fidelity Investments has not adopted it as an official forecast.
What is the $82,500 level?
It is the breakout point from Bitcoin’s double-bottom pattern. Analysts say a clean move above $82,500 would confirm the pattern and open a technical path toward $100,000.
The Bottom Line
One of Wall Street’s most respected macro voices has planted a flag: the bear market is over, and the math points much higher. The $60,000 floor held, the gold signal turned green, and Bitcoin has spent two weeks proving it can live above $80,000.
The next test is $82,500. Break it, and $100,000 comes into view. Fail, and $80,000 becomes the line to defend. This is not financial advice, and crypto stays volatile. But the signal from Fidelity’s macro desk is now unmistakably bullish.
Next step: Watch the $82,500 breakout level this week, and check our October 2026 Bitcoin outlook for the levels that decide the rest of the month.
Disclaimer: This article is for informational purposes only and does not constitute investment advice. Cryptocurrency markets are volatile. Do your own research before making any investment decision.