



Bitcoin fell to about $55,130 on November 21, its lowest price since September 2024, then bounced more than 8% and briefly retook $60,000 within hours. By Sunday morning in Pakistan it traded near $59,460, still about 53% below its all-time high of $126,080 from October 2025.
The bounce looks dramatic, but the engine behind it was forced buying, not fresh demand. Short traders had to buy back in a hurry, and that buying pushed the price up fast.

Key takeaways
- Bitcoin hit an intraday low of about $55,130 on November 21, its lowest since September 2024, then bounced more than 8% back above $60,000.
- About $2.4 billion in crypto futures positions were liquidated in 24 hours, and longs made up about 92.6% of that total.
- The bounce ran on a short squeeze. In one hour, $68.8 million of short positions closed against only $1.6 million of longs.
- US spot Bitcoin ETFs have lost about $3.59 billion in November, with outflows on 13 of 14 sessions through November 19.
- The Crypto Fear and Greed Index reads 11, deep in Extreme Fear, and the next test comes when US markets reopen on Monday.
The crash and the bounce, in numbers
One table holds the whole story. Every reading below comes from fresh market data, checked at publish time.
| Reading | Number | Source |
|---|---|---|
| Intraday low, Nov 21 | About $55,130 | Binance, CoinDesk |
| Rebound high | Near $60,996 | Finnhub 24h window |
| Bounce from the low | More than 8% | CoinDesk, CryptoCompass |
| Price, Nov 22 04:10 UTC | Near $59,460 | Finnhub, Binance BTC/USDT |
| Daily close, Nov 19 | $61,986.73 | Finnhub, Binance |
| Daily close, Nov 20 | $58,951.51 | Finnhub, Binance |
| Daily close, Nov 21 | $57,884.49 | Finnhub, Binance |
| Crypto liquidations, 24h | About $2.4 billion | CoinGlass |
| Bitcoin longs liquidated | About $1.02 billion | CoinGlass |
| Traders liquidated | 343,141 | CryptoPotato |
| Spot ETF outflows, Nov | About $3.59 billion | Farside, SoSoValue |
| Fear and Greed Index | 11, Extreme Fear | Alternative.me, CoinGlass |
| Daily RSI | About 22, oversold | TradingView |
| Fall from all-time high | About 53% | ATH $126,080, Oct 6 2025 |
The bounce faded before the day ended. Bitcoin closed November 21 at $57,884 on the UTC daily candle, below $60,000 again, then climbed back toward $59,460 by Sunday morning.
That detail matters. A bounce that cannot hold $60,000 into the close is a relief move, not a reversal, and the scorecard below explains why.
Why Bitcoin fell so fast
Bitcoin did not fall on one headline. It fell because several pressures hit at once, and leveraged traders had no room to absorb them.
The week set the trap. Bitcoin traded above $70,000 early in the week, then slipped below $65,000 on Tuesday, $62,000 on Thursday, and $60,000 on Friday.

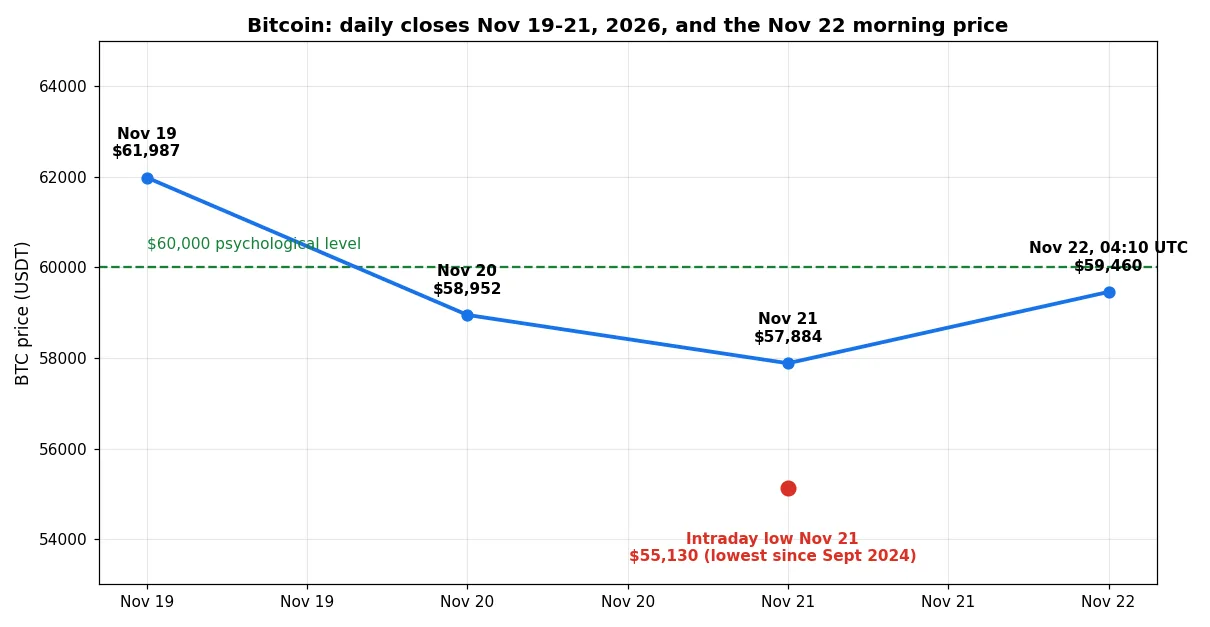
Bitcoin daily closes from November 19 to November 21, 2026, with the November 21 intraday low marked. Sources: Finnhub, Binance BTC/USDT.
The $2.4 billion liquidation flush
Leverage turned a bad week into a crash. Traders who borrowed money to bet on higher prices watched their positions close automatically as $60,000 gave way.
CoinGlass puts the 24-hour liquidation total near $2.4 billion across crypto futures. Bitcoin longs accounted for about $1.02 billion of it, and Ether added about $545 million.
Longs made up about 92.6% of all liquidations in that window. The largest single forced close was a $51.71 million Bitcoin long.
Friday showed how fast the cascade runs. As the Nasdaq deepened its fall and Bitcoin broke $60,000, about $94.6 million in Bitcoin positions were liquidated within one hour on just three exchanges, Binance, Bybit, and OKX.
Each forced sale pushed the price lower, and each lower price forced more sales. That loop is what carried Bitcoin from $60,000 to $55,130 in hours.
Tech stocks dragged Bitcoin down
The Nasdaq fell more than 4% on Friday in a tech-led rout. Bitcoin moved with it, and the link is not a coincidence this month.
Bitcoin’s 40-day correlation with the Nasdaq 100 sat near 0.69 during November. When tech sold off, crypto sold off with it.
Analysts point to worries about AI stock valuations, rising inflation-adjusted Treasury yields, and a more hawkish Federal Reserve outlook. The midterm election outcome, the Anthropic IPO, and a major Binance hack added to the nervous mood.
QCP Capital put it plainly in its November 20 note. A lasting recovery needs tech stocks to stabilize, rate volatility to calm down, and corporate buyers to return.
The squeeze that pushed Bitcoin back above $60,000
The bounce started the same way the crash did, with leverage. This time the trapped side was the shorts.
Traders who bet on further falls piled in as Bitcoin broke $56,000. When the price stopped falling and turned, those shorts had to buy back, and their buying became the rally.
The numbers show the flip clearly. In one hour during the recovery, about $68.8 million in short positions closed against only $1.6 million in longs, so shorts made up 97.7% of forced closes in that window.
About $230 million in shorts were liquidated in four hours, against just $23 million in longs. Forced buying did the heavy lifting, and it pushed Bitcoin back above $60,000.
This pattern is familiar. Bitcoin rebounded above $80,000 after the midterms in a similar squeeze, when short covering pushed the price through a round number while ETF flows still pointed the other way.
A squeeze can move the price fast, but it burns its own fuel. Once the shorts finish closing, the buying stops, and the price needs real demand to stay up.
What the bounce proves, and what it does not
The bounce proves that buyers still defend the mid-$50,000s. Bitcoin found bids at $55,130, and the daily candle left a long lower wick, which traders read as rejection of the low.
It also proves that the market was heavily short at the bottom. The squeeze ratios leave no doubt about that.
It does not prove that the low will hold. Spot demand has not returned, and the buyers who usually absorb selling have gone quiet.
US spot Bitcoin ETFs lost about $3.59 billion in November, with outflows on 13 of 14 sessions through November 19. BlackRock’s IBIT outflow of $541.1 million on November 19 was its largest single-day outflow since the fund launched, and it made up about 93% of that day’s total.
Friday added $124.4 million more in outflows, led by Fidelity’s FBTC at $72.38 million. Wintermute expects more downward pressure while flows stay negative.
Sentiment backs the caution. The Crypto Fear and Greed Index reads 11, deep in Extreme Fear, and it has sat in extreme fear for 7 to 9 straight days.
Our earlier guide to extreme fear and a falling RSI explains why these readings often mark emotional turning points, and why they still need confirmation before anyone calls a bottom.
The levels that decide what happens next
Four price levels now frame the whole trade. Each one has a clear job, and the market will test them in order.
| Level | Price | Why it matters |
|---|---|---|
| On-chain support | $53,500 to $53,700 | CryptoQuant and Glassnode put the on-chain cost basis here |
| Psychological level | $60,000 | Round number, held since July until Nov 20, now a battleground |
| First resistance | $62,000 | Wintermute’s first major level, also the top of the recent buyer cluster |
| 200-week moving average | About $68,000 | Wintermute wants a daily close here for a bullish short-term read |
The $53,500 to $53,700 zone is the line that matters most below. CryptoQuant puts Bitcoin’s on-chain realized price near $53,500, and Glassnode points to about $53,700.
If $55,130 breaks on a daily close, that zone is the next stop. A break below it would open the door toward $50,000, where Wintermute sees the next pressure building.
Above, $62,000 is the first real test. Recent buyers cluster between $62,000 and $66,000, so reclaiming that range would show fresh demand, not just short covering.
The daily RSI near 22 says the market is deeply oversold, but oversold can stay oversold. Bitcoin traded near $57,200 with an RSI of 27 back in January 2026, and the fear lasted weeks.
What to watch on Monday
Monday is the first real test of the bounce. US markets reopen after the Nasdaq fell more than 4% on Friday, and CoinDesk flags that open as the moment that decides whether the rebound holds.
Watch three things in order. First, whether Bitcoin holds $60,000 through US trading hours without another liquidation wave.
Second, the next ETF flow print. A single day of inflows would not end the outflow streak, but it would break a run of 13 losing sessions in 14.
Third, the tech open. If chip and AI stocks stabilize, Bitcoin gets room to breathe, and if they fall again, the correlation near 0.69 says Bitcoin likely follows.
Later in the week, the US October PCE inflation data lands on November 25. That report shapes Federal Reserve expectations, and rate expectations have driven much of this selloff.
History adds a warning, not a promise. Bitcoin has averaged a 34.4% gain in November since 2010, and it closed the month positive in 10 of 16 years, yet this November is on track to be one of the weakest.
Mistakes to avoid after a crash like this
The first mistake is calling the bottom after one green bounce. A short squeeze looks like a recovery for a few hours, and it fades when the forced buying ends.
The second mistake is treating $60,000 as a safe floor. Bitcoin held it since July, then lost it in a day, and round numbers break fast when leverage unwinds.
The third mistake is buying with leverage to catch the rebound. The same liquidation machine that wiped out $2.4 billion in longs will wipe out new longs just as fast if Monday opens lower.
New readers should start with the basics before they act. Our guide to how Bitcoin works explains the network, the risks, and the role of ETFs in plain language.
Anyone thinking about buying should also read our guide to buying Bitcoin first. It covers exchanges, custody, and the volatility that this week showed in full.
This article is not investment advice. It reports what happened, what the data shows, and what has to change before the low can be trusted.
FAQs
Here are the questions readers ask most about the Bitcoin two-year low rebound.
How low did Bitcoin fall on November 21, 2026?
Bitcoin fell to about $55,130, its lowest price since September 2024. Some feeds printed $55,251.60, and the small gap comes from different exchanges reporting slightly different prices.
How much did Bitcoin bounce from the low?
Bitcoin bounced more than 8% from the low and briefly retook $60,000, with a high near $60,996 in the 24-hour window. By Sunday morning it traded near $59,460, and the November 21 daily close was $57,884.
Why did Bitcoin crash to a two-year low?
A tech stock selloff, ETF outflows, and leveraged long positions combined into a liquidation cascade. About $2.4 billion in crypto futures positions were liquidated in 24 hours, and longs made up about 92.6% of that total.
What caused the bounce back above $60,000?
A short squeeze caused the bounce. Traders who bet on further falls had to buy back quickly, and in one hour $68.8 million in short positions closed against only $1.6 million in longs.
Will Bitcoin hold above $60,000?
Nobody knows yet. The bounce ran on forced buying, ETF outflows are still running at about $3.59 billion for November, and the real test comes when US markets reopen on Monday and the next ETF flow data arrives.
Bitcoin fell to a two-year low and bounced 8% in hours, and both moves ran on leverage. The flush cleared the longs, the squeeze cleared the shorts, and the price now sits between $53,500 support and $62,000 resistance.
Watch Monday’s open, the next ETF flows, and the PCE report on November 25. Until inflows return and tech stocks calm down, treat this as a bounce inside a downtrend, not a bottom.