



Ethereum trades near $2,490 on October 10, 2026, almost exactly half its all time high. That one fact explains the split in every forecast you will read this month. Bulls see a top network on sale. Bears see a coin that keeps losing money to Bitcoin. This ethereum price prediction 2026 2030 guide maps both sides with dated numbers, not slogans.
The short answer first. Our base case puts ETH near $3,030 at the end of 2026, near $3,600 in 2027, and at $10,000 by 2030. The bear case keeps it under $4,500 even in 2030. The bull case reaches $20,000 by 2030, and one major bank goes twice as high. Below, we show what has to happen for each path, and the two price levels that tell you which path is winning.

Key takeaways
- ETH trades near $2,490 with a market cap near $304 billion, about 50% below its $4,958 high from August 24, 2025.
- US spot Ethereum ETFs lost $201.9 million on October 6 and $407.8 million over six sessions, while Bitcoin ETFs gained $239 million in the same period.
- Citi sees $3,028 in 12 months. Standard Chartered cut its 2026 target to $4,000 but kept $40,000 for 2030.
- Support is $2,400 to $2,500. Resistance is $2,800. A weekly close above $2,800 changes the short term story.
- The Glamsterdam test on Sepolia ran near 200 million gas per block this week, up from about 60 million, with no mainnet date set yet.
- Every number after 2026 is a scenario, not a promise. Nobody knows the 2030 price.
Ethereum price today: where ETH stands on October 10, 2026
Price context comes before any forecast. A coin at record highs needs a different read than a coin in repair mode. Ethereum right now is in repair mode, and the data shows it clearly.
- Ethereum price today: where ETH stands on October 10, 2026
- Ethereum price prediction 2026 2030: the full scenario table
- The ETF problem: $407.8 million walked out in six days
- Network health: staking queues, low exchange supply and Glamsterdam
- Year by year: what each case needs to happen
- Support, resistance and the levels that invalidate each case
- Common mistakes when reading Ethereum forecasts
- FAQs
- Conclusion: a repair year, then a real test
Trackers put ETH between $2,486 and $2,496 today, down about 7% over seven days and only slightly higher over 30 days. Daily trading volume sits near $8.5 billion, so this is still the second most liquid coin in crypto, behind only Bitcoin. If you want the basic split between the two, our guide to Bitcoin vs Ethereum and the key differences for beginners covers it in plain words.
The numbers that frame every forecast
About 122.1 million ETH are in circulation, which gives the $304 billion market cap at today’s price. The August 2025 high near $4,958 feels close on a chart. In money terms it is not. Getting back there means the market has to add roughly $300 billion of value to Ethereum alone.
Derivatives tell a calmer story than the red week suggests. Futures open interest stands near $31.83 billion, and 24 hour liquidations were only $12.73 million, split almost evenly between longs and shorts. That is choppy trading, not a panic flush. Panic weeks usually show one sided liquidations in the hundreds of millions.
Ethereum price prediction 2026 2030: the full scenario table
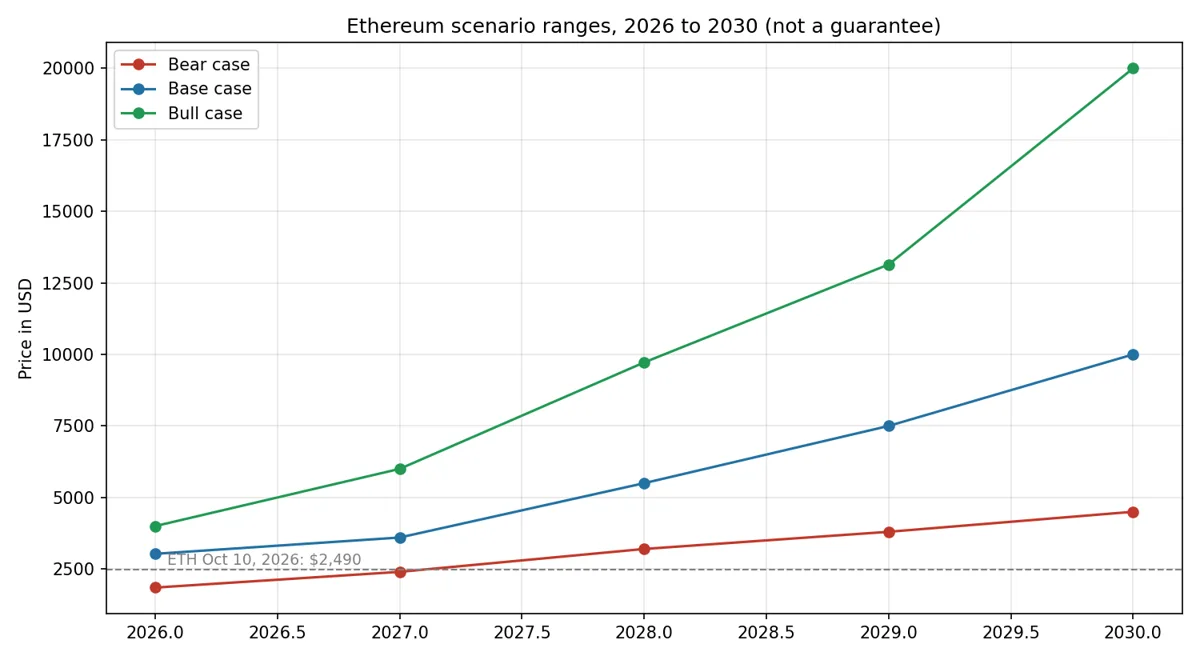
Here is the table most readers came for. These are our scenario ranges for year end prices, built from the published bank targets and model ranges cited in this article. They are not a single model’s output, and they are not guarantees.

| Year | Bear case | Base case | Bull case | What decides it |
|---|---|---|---|---|
| 2026 | $1,850 | $3,030 | $4,000 | ETF flows turn, $2,800 breaks |
| 2027 | $2,400 | $3,600 | $6,000 | Glamsterdam on mainnet, fee use grows |
| 2028 | $3,200 | $5,500 | $9,721 | Bitcoin halving cycle lifts all majors |
| 2029 | $3,800 | $7,500 | $13,144 | Tokenized assets and stablecoin growth |
| 2030 | $4,500 | $10,000 | $20,000 | Sustained institutional demand for years |
The chart below plots the same three paths against today’s price. Notice how flat the bear case is. That is deliberate. A bear case is not a crash to zero. It is years of sideways frustration while Bitcoin takes the institutional money.
How these ranges compare with published forecasts
Our base case for 2026 sits almost exactly on Citi’s number. The bank raised its 12 month Ether target to $3,028 from $2,240 on October 1, citing higher crypto activity and renewed ETF interest. Our bull case for 2026 uses Standard Chartered’s revised $4,000 target. The bank cut that figure by 47% from $7,500, which tells you how much the near term mood has cooled.
Longer term, the spread gets wild. A cautious model from CoinDCX puts ETH at $3,300 in December 2026, $3,600 in 2027 and $5,600 in 2030. Consolidated analyst tables go much higher, with bull figures near $9,721 for 2028 and $13,144 for 2029. Standard Chartered tops the list at $40,000 by 2030. We treat $40,000 as an outlier, not a base case, because it needs a market cap near $4.8 trillion at today’s supply.
The ETF problem: $407.8 million walked out in six days
No forecast works without the flow data, and right now the flow data is ugly for Ethereum. This is the single biggest reason near term targets got cut.
US spot Ethereum ETFs lost $201.9 million on October 6, the biggest daily outflow since mid September, according to SoSoValue data reported this week. That extended a streak that started on September 29 to $407.8 million over six sessions. October 7 added $160.9 million of outflows, with BlackRock’s ETHA fund alone accounting for $116.05 million. October 8 added another $72.54 million.

Rotation into Bitcoin, not an exit from crypto
Context matters here. Over the same six sessions, Bitcoin ETFs pulled in a net $239 million, and on October 6 alone they gained $118.8 million while Ether funds lost $201.9 million. Money did not leave crypto. It moved sideways into Bitcoin. You can see the same preference in our Bitcoin price prediction 2026 with year end targets, where institutional demand stayed firmer.
The longer record is still positive. Since their July 2024 launch, US spot Ether ETFs have taken in $13.549 billion in cumulative net inflows and hold about $17.356 billion in assets, equal to 5.27% of Ethereum’s market cap. ETHA holds about $13.036 billion of those historical inflows. One fund dominating flows cuts both ways. When ETHA clients sell, the whole category prints red.
There is also a new demand channel opening abroad. Our coverage of Thailand approving Bitcoin and Ether ETFs for listing from October 16 shows local funds there can now hold Ether with regulated custodians. It will not replace US flows, but it widens the buyer base.
Network health: staking queues, low exchange supply and Glamsterdam
Flows are the bad news. The network itself is the better news, and honest analysis has to weigh both.
Staking demand is still large. Validator queue data this week showed about 1,397,669 ETH waiting to enter staking, with an estimated wait near 24 days, while about 817,231 ETH sat in the exit queue with a wait near 14 days. Both queues moving at once is normal in a choppy market. The entry queue being larger is the quiet bullish detail. For how the staking system got here, read our explainer on Ethereum 2.0 and the upgrade that changed everything.
Glamsterdam: a real capacity test, not a price promise
Ethereum’s next upgrade, Glamsterdam, activated on the Sepolia test network this week. Test blocks ran with a gas limit near 200 million, up from about 60 million before. CoinDesk reviewed more than 25 test blocks and found they used about 52 million to 92 million gas each, or 26% to 46% of the new allowance. A separate Hoodi test is tentatively planned for October 27, and no mainnet date is set.
What does that mean in plain words? Gas is the unit that measures work on Ethereum. A bigger limit means each block can carry more work before fees spike. The upgrade also puts the handoff between block builders and validators into the protocol rules, a change called enshrined proposer builder separation. If it reaches mainnet in the fourth quarter as expected, plain transfers between existing accounts could get much cheaper. That helps use. It does not by itself create buyers, which is why our base case only lifts after 2026. Our deeper piece on how Ethereum works under the hood explains gas and validators without jargon.
The fee tension bulls do not like to mention
Here is the honest catch. Cheaper fees mean less ETH gets burned under the EIP-1559 system, and more activity now sits on layer 2 networks. So network growth does not lift the token price one for one anymore. That fee tension is a real reason cautious models like the $5,600 by 2030 path exist, and why rival chains in our Solana price prediction 2030 keep taking speculative attention.
Year by year: what each case needs to happen
Tables are easy to print and hard to defend. So here is the logic year by year, in short form.
For the rest of 2026, ETH first has to stop the ETF bleeding. Two or three positive flow weeks in a row would do more for price than any upgrade headline. Then it needs a weekly close above $2,800. Analyst Ted Pillows flagged that level this month, and it has capped price since late September. Above $2,800, $3,000 and then Citi’s $3,028 zone come into view fast.
2027 and 2028: upgrades meet the halving cycle
In 2027 the question is whether Glamsterdam on mainnet brings activity back to the base layer without crushing fee income. In 2028 the Bitcoin halving, expected around April that year, historically lifts liquidity across crypto. Our Bitcoin price prediction 2030 with models compared shows why that cycle still matters for every major coin, Ethereum included. If Bitcoin has a strong halving cycle and Ether ETFs are net buyers again, the $9,721 bull figure for 2028 stops looking silly.
2029 and 2030: tokenization or disappointment
By 2029 and 2030 the story is no longer about trading. Standard Chartered’s long term case rests on stablecoins and tokenized real world assets growing into much larger markets, with Ethereum capturing a big share. That is plausible. Ethereum still hosts the largest developer base and the deepest DeFi system. But plausible is not certain, and a $10,000 base case already assumes a lot goes right for five straight years.
Support, resistance and the levels that invalidate each case
Levels keep a forecast honest. Write these down and check them monthly instead of rereading predictions.
Support sits at $2,400 to $2,500 first. ETH is testing the top of that zone right now. Below it, $2,350 to $2,360 is the warning line, and a break there opens $2,321 and then the $2,100 area that analysts call the critical floor. Resistance is $2,800 first, then $3,000, then the long road to the $4,958 high, where a rising multi year channel also tops out.
A simple rule for readers
Weekly closes tell the truth better than daily spikes. A weekly close above $2,800 moves you toward the base and bull cases. A weekly close below $2,350 moves you toward the bear case, whatever the headlines say that week. If you decide to buy at any level, our guide on how to buy Ethereum and the real cost comparison shows the fee differences between popular routes.
Common mistakes when reading Ethereum forecasts
Most forecast pain comes from three simple errors. People treat a bank’s bull target as a base case. They ignore supply, so $40,000 sounds like $4,000 until you multiply by 122.1 million coins. And they forget that past model tables, including older ones on this topic, were written when ETH traded at very different prices.
The fix is boring and it works. Ask three questions of any prediction. What price and date was it written at? What has to happen for it to come true? And what level proves it wrong? This article tried to answer all three for its own table.
FAQs
What is a realistic Ethereum price prediction for 2026?
A realistic range for the end of 2026 runs from about $1,850 in a bear case to $4,000 in a bull case, with a base case near $3,000. Citi raised its 12 month target to $3,028 on October 1, while Standard Chartered cut its year end 2026 target to $4,000 from $7,500 and kept its $40,000 call for 2030.
Can Ethereum reach $10,000 by 2030?
Yes, $10,000 by 2030 sits inside our base case, but it is not guaranteed. It needs spot Ether ETF flows to turn positive again, the Glamsterdam upgrade to lift network use without hurting fees too much, and no deep global recession. Standard Chartered goes much further at $40,000 by 2030, while more cautious models stay near $5,600.
Why are Ethereum ETFs seeing outflows in October 2026?
US spot Ethereum ETFs lost $201.9 million on October 6 alone, the biggest daily outflow in three weeks, and $407.8 million over six sessions from September 29. Over the same six days Bitcoin ETFs took in a net $239 million, so the pattern looks like rotation into Bitcoin during macro uncertainty, not a full exit from crypto.
What price levels matter most for ETH right now?
Support sits at $2,400 to $2,500 first, then near $2,350. Resistance sits at $2,800, where ETH needs a weekly close to rebuild momentum, then $3,000, and much higher at the August 2025 all time high near $4,958. A weekly close above $2,800 helps the bull case. A break below $2,350 hurts it.
Is Ethereum a good buy at $2,490?
That depends on your risk tolerance, and this article is not financial advice. At $2,490 ETH trades about 50% below its August 2025 high, which bulls read as value and bears read as a warning. Staking queues, low exchange balances and the Glamsterdam test are positives. ETF outflows and a fragile chart are negatives. Never invest money you cannot afford to lose.
Conclusion: a repair year, then a real test
Ethereum at $2,490 is not a broken asset. It is a large, heavily used network having a bad quarter for flows while its engineers ship a serious capacity upgrade on testnet. Our ethereum price prediction 2026 2030 view is patient for that reason. Base case $3,030 in 2026, $10,000 by 2030, with $2,800 above and $2,350 below as the levels that prove us right or wrong.
The next step is simple. Watch the weekly ETF flow totals and the weekly close around $2,800 before you watch any influencer target. Flows turned this market down in October. Flows will be the first sign they are turning it back up.