



Bitcoin traded near $63,350 on Thursday morning, November 19, 2026. It has fallen below the bitcoin 200-week moving average near $68,000, a line that has marked the floor of past bear markets.
The drop puts Bitcoin about 50 percent below its all-time high of $126,080. It also leaves the coin below its 200-day average near $73,000, so both long-term trend lines now sit overhead.

This is not a normal dip. Bitcoin has spent only about 8 percent of its life below the 200-week average, and a weekly fall of this size through the line has happened only three times since 2013.
- Key Takeaways
- What the Bitcoin 200-Week Moving Average Actually Is
- Where Bitcoin Stands Right Now
- Every Time Bitcoin Lost This Line Before
- Why the Slide Happened
- The $60,000 Question: What Happens Next
- What Has to Change for the Slide to Stop
- What This Means If You Hold Bitcoin
- Mistakes to Avoid Right Now
- Frequently Asked Questions
Here is what the line is, what happened every time Bitcoin lost it before, and what has to change for the slide to stop.
Key Takeaways
- Bitcoin trades near $63,350, below its 200-week moving average near $68,000 and its 200-day average near $73,046.
- The weekly close on November 16 was $65,351, the first weekly close below the 200-week average since August.
- Bitcoin has closed below the line on only 384 of 4,568 days since 2014, about 8.4 percent of its history.
- The last break, in June 2026, lasted 25 days and bottomed 6.3 percent below the line before price rose 33 percent in the next 90 days.
- ETF outflows drove the slide. IBIT lost about $2.35 billion over 11 straight sessions before a single $76.5 million inflow on November 16, and the group lost about $240 million again on November 17.
What the Bitcoin 200-Week Moving Average Actually Is
The 200-week moving average is the average of Bitcoin’s weekly closing prices over the past 200 weeks, or almost four years. It smooths out daily noise and shows what the average long-term buyer has paid over a full market cycle.
Traders treat it as a floor because Bitcoin rarely trades under it. The line climbs slowly, about 23 percent in the past year, because old low prices keep rolling out of the 200-week window and newer, higher prices replace them.
Why traders watch this line more than other averages
Short averages react to every headline. The 200-week average moves so slowly that a break below it means the whole market has changed direction, not just had a bad week.

That is why the line gets called the market’s emergency floor. It has held at the worst moments of past cycles, and losing it has always meant real pain before any recovery.
Where Bitcoin Stands Right Now
Bitcoin closed at $64,023 on Wednesday, November 18, after falling 2.9 percent on the day. It opened Thursday near $63,350, down 14.8 percent over seven days and 21.7 percent over the past month.
The table below shows how far the price sits from every line that matters. Each figure comes from live market data checked on the morning of November 19.
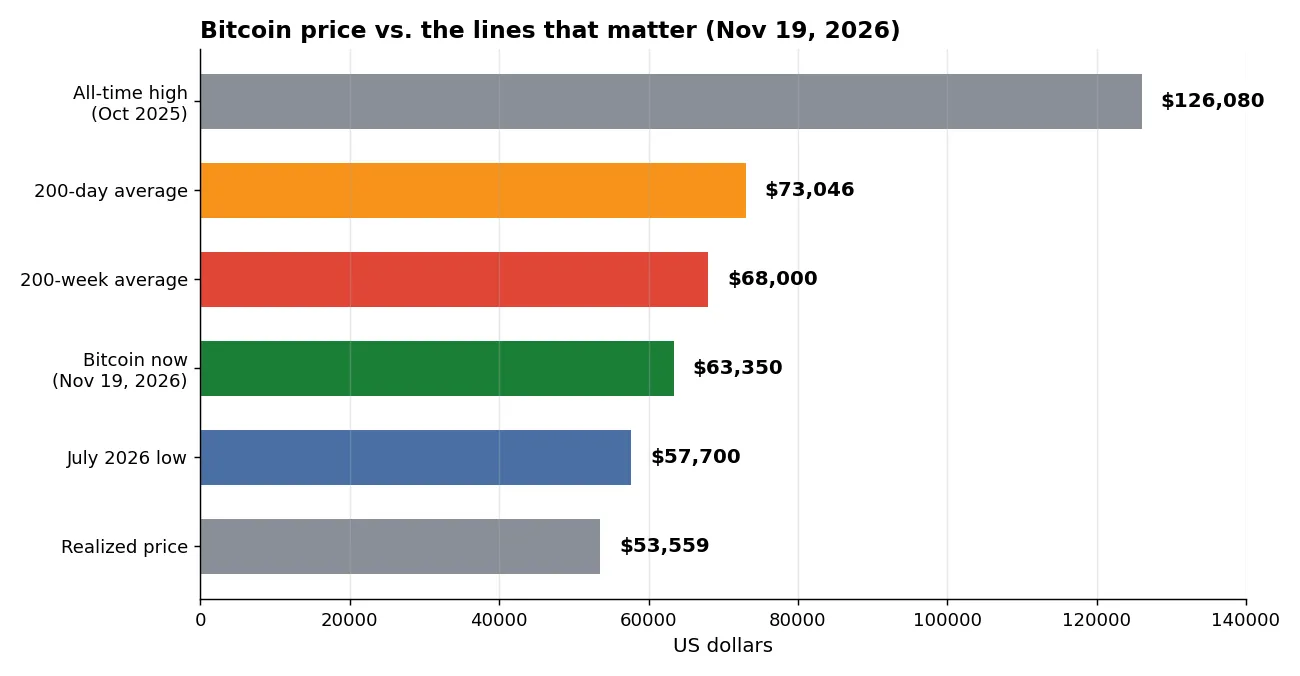
| Level | Price | Where the price sits |
|---|---|---|
| All-time high (October 2025) | $126,080 | Price is about 50 percent below it |
| 200-day moving average | $73,046 | About $9,700 above the price |
| 200-week moving average | $68,000 | About $4,650 above the price |
| Bitcoin now (November 19) | $63,350 | Below both averages |
| July 2026 low | $57,700 | About $5,650 below the price |
| Realized price | $53,559 | About 17.5 percent below the price |
The slide in one week
The week started with a close of $64,882 on Monday, November 16. Two days later the price had lost another $860, and the daily RSI sat at 21.6, deep in oversold territory.
The Crypto Fear and Greed Index read 10 on Thursday, its lowest level since June. That puts the market in Extreme Fear, and it matches the mood of the ETF flows.
Every Time Bitcoin Lost This Line Before
Counting this one, Bitcoin has fallen below the 200-week average eight times since 2014. The two most recent breaks tell the story best, because they happened in the same year and under similar conditions.
| Detail | June 2026 break | November 2026 break |
|---|---|---|
| First close below the line | June 5, 2026 | November 14, 2026 |
| Days below the line | 25 | 5 so far |
| Lowest point | $58,525 (6.3 percent below the line) | $61,950 (8.9 percent below the line) so far |
| Price 90 days later | Up 33 percent | Not yet known |
The June break lasted 25 days. Price bottomed at $58,525, or 6.3 percent below the line, then climbed back above it in mid-August and gained 33 percent over the next 90 days.
The November break is still young. The low so far is $61,950, set on Sunday, November 15, about 9 percent below the line, and that is already deeper than the June low after only five days below it.
The three rare crashes
CoinDesk checked every week since 2013 and found only three crashes like this one: a weekly fall of 12 percent or more that also pushed price below the 200-week average. Prices stood higher three months later in each of the three cases.
That record is encouraging, but it rests on three examples. Three cases cannot prove a rule, and each of those crashes came near the end of a bear market, not at the start of one.
Why the Slide Happened
The main driver is money leaving Bitcoin ETFs. US spot Bitcoin ETFs lost a net $2.35 billion over the two weeks through November 13.
BlackRock’s IBIT drove the retreat, with about $2.35 billion leaving the fund over 11 straight sessions from October 30 to November 13.
The streak broke on Monday, November 16, when IBIT took in $76.5 million, but the relief lasted one day. The group lost about $240 million on Tuesday, November 17, with IBIT accounting for $210 million of it.
The outflows are part of a longer pattern. The longest streak of daily net outflows for US Bitcoin ETFs shows how the selling built up through the autumn, and the plunge to $62,000 came with US sellers and ETF redemptions doing most of the damage.
Macro pressure added to the selling. Minutes from the Federal Reserve’s October meeting, released on Wednesday, pointed to a December rate hike, and markets now price about a 92 percent chance of one.
The US 10-year Treasury yield rose about 30 basis points that week to 5.15 percent.
Higher rates hurt Bitcoin because they raise the return on safe assets. When the 10-year yield pays more than 5 percent, holding a volatile asset with no yield looks less attractive, and some investors sell.
The $60,000 Question: What Happens Next
The next test sits just below the current price. Market maker Wintermute calls the $62,000 low from Saturday the first level, and it calls the $60,000 options cluster on Deribit the next magnet.
Options clusters pull price toward them because traders hedge their positions as the level approaches. Our earlier report on why the $60,000 line could decide Bitcoin’s direction explains why that round number has mattered before.
Below $60,000, the next real support is the July low near $57,700. Wintermute has warned of pressure into the $50,000 range, and analyst Benjamin Cowen has said Bitcoin could fall as low as $40,000 if the 200-week average fails to hold as support.
The deeper floor is the realized price near $53,559, which is the average price at which all Bitcoin last moved on-chain. Bitcoin still trades about 17.5 percent above that level, so the market has room to fall before it reaches the price where the average holder breaks even.
The selling is not only about ETFs, because listed companies and miners have also been cashing out, with miners selling $8.08 billion of Bitcoin to fund AI spending. That supply adds to the pressure while buyers stay on the sidelines.
What Has to Change for the Slide to Stop
A line on a chart cannot stop a slide by itself. Four things need to change, and Wintermute named two of them directly in its November 16 market note.
| What has to change | Why it matters | Status now |
|---|---|---|
| A daily close back above $68,000 | Price must close a full day above the 200-week average, not just poke above it for an hour. A close above the line would turn it back into support instead of resistance. | Not yet. Price sits about $4,650 below the line. |
| Spot ETF inflows return | The group needs several days of net inflows, not one. The $76.5 million IBIT inflow on November 16 recovered only about 3 percent of the $2.35 billion the fund lost. | Not yet. The group lost $240 million on November 17. |
| The Fed outlook softens | The October PCE inflation data or the Fed minutes must remove the expectation of another rate hike in January. Until then, every rally faces the same rate pressure. | Not yet. Markets price a 92 percent chance of a December hike. |
| The $60,000 level holds | If the options cluster at $60,000 holds, buyers get a base to build from. If it breaks, the July low near $57,700 becomes the next test, and the $50,000 range opens up. | Being tested. The November 15 low was $61,950. |
None of these four has happened yet. That is the honest answer to the question of when the slide stops: it stops when buyers return with real money, and the ETF flows will show that before the price does.
What This Means If You Hold Bitcoin
History says breaks below this line have not lasted long. The June break lasted 25 days and price recovered 33 percent in 90 days.
The 2022 bear market was the exception: it stayed below the line far longer and fell much deeper.
None of that makes this a buying signal, because averages describe the past and cannot tell you where the price goes next. What they can tell you is that the market is now in a place it visits rarely, and rarely stays in for long.
If you hold Bitcoin, watch the four items in the checklist above instead of the hourly price. The daily close, the ETF flows and the Fed outlook will tell you when the picture changes.
This article is not financial advice, and nobody can promise the line holds.
The wider damage is already visible. Bitcoin has dropped out of the world’s top 15 assets after the $63,000 crash, and the slide began well before this week, when Bitcoin crashed to a two-month low near $73,700 after the midterm sweep.
Mistakes to Avoid Right Now
The first mistake is treating the 200-week average as a buy button. The line has marked cycle lows in the past, but it has also stayed below price for months in a real bear market, and buying the first touch has cost money before.
The second mistake is panic-selling into Extreme Fear. The Fear and Greed Index reads 10, its lowest since June, and that is exactly when the worst selling decisions happen.
The third mistake is trusting one indicator, because the 200-week average, the ETF flows, the Fed outlook and the options market all point the same way right now, but any one of them can change fast. Check all four before you act.
Frequently Asked Questions
Here are the questions readers keep asking about Bitcoin and the 200-week moving average.
What is the Bitcoin 200-week moving average?
It is the average of Bitcoin’s weekly closing prices over the past 200 weeks, or almost four years. It sits near $68,000 in November 2026, and it rises slowly because older, lower prices keep rolling out of the 200-week window.
Why does falling below the 200-week average matter?
Bitcoin has spent only about 8.4 percent of its history below this line, or 384 of 4,568 days since 2014. The line has marked the floor of past bear markets, so losing it tells traders the whole market has changed direction, not just had a bad week.
How far has Bitcoin fallen from its all-time high?
Bitcoin traded near $63,350 on November 19, 2026, about 50 percent below its all-time high of $126,080 set in October 2025. It has also fallen about 28 percent from the high above $87,000 it reached in early October 2026.
What could push Bitcoin back above the 200-week average?
Price needs a daily close above about $68,000, several days of net inflows into spot Bitcoin ETFs, and a softer outlook for US interest rates. Wintermute said it would drop its defensive view if the first two happened together.
Could Bitcoin fall to $50,000?
It is possible, because Wintermute has warned of pressure into the $50,000 range, and analyst Benjamin Cowen has said Bitcoin could fall as low as $40,000 if the 200-week average fails to hold as support. The nearer tests are $60,000 and the July low near $57,700.
Bitcoin now trades in a place it rarely visits: below a line it has spent only 8 percent of its life under. History says these visits have ended with higher prices, but history also says the 2022 visit lasted months and went far deeper.
The next few days will tell us which kind of break this is. Watch the daily close against $68,000, the ETF flows, and the $60,000 options cluster.
The line is not the story. The money flowing in or out is.