Spot Ether exchange-traded funds (ETFs) had their second-largest day of inflows on August 5 despite a drastic price decline that saw ETH lose over 20% of its value.
Data from SoSoValue shows that since spot ETH ETFs started trading on July 23, they have seen only four days of positive net inflows.
Ether was trading at $2,454 as of 07:21 a.m. EST after a significant gain of 8% in the last 24 hours.
Spot Ether ETFs Post Inflows Despite Price Drop
On August 5, the cumulative net inflows from the nine spot Ether ETFs trading on US exchanges came to $48 million, marking the fourth day of positive net inflows.
The BlackRock ETH ETF had the highest inflows of $47 million. Followed by Fidelity and VanEck, whose ETH ETFs garnered net inflows of $16 million each. The Grayscale mini Ether ETF and Bitwise also saw net inflows of $7 million each.
The Grayscale Ethereum Trust ETF continued with a steady streak of outflows, which totaled $46 million on Monday. Grayscale outflows since the spot ETH ETFs started trading have surpassed $2 billion.
These outflows have been dampening Ether’s performance, with analysts saying that the trend could change in the coming days once the Grayscale outflows slow down. The same thing happened with spot Bitcoin ETFs, which saw billions in outflows before BTC hit an all-time high around two months after the products started trading.
Spot Ether ETFs have seen positive inflows for only four days since the products started trading. The highest day of inflows was on July 23, with $106M inflows. The second-highest day was on July 30 with $33M inflows while August 1 saw $26 million inflows.

Ether Price Analysis As ETH Recovers
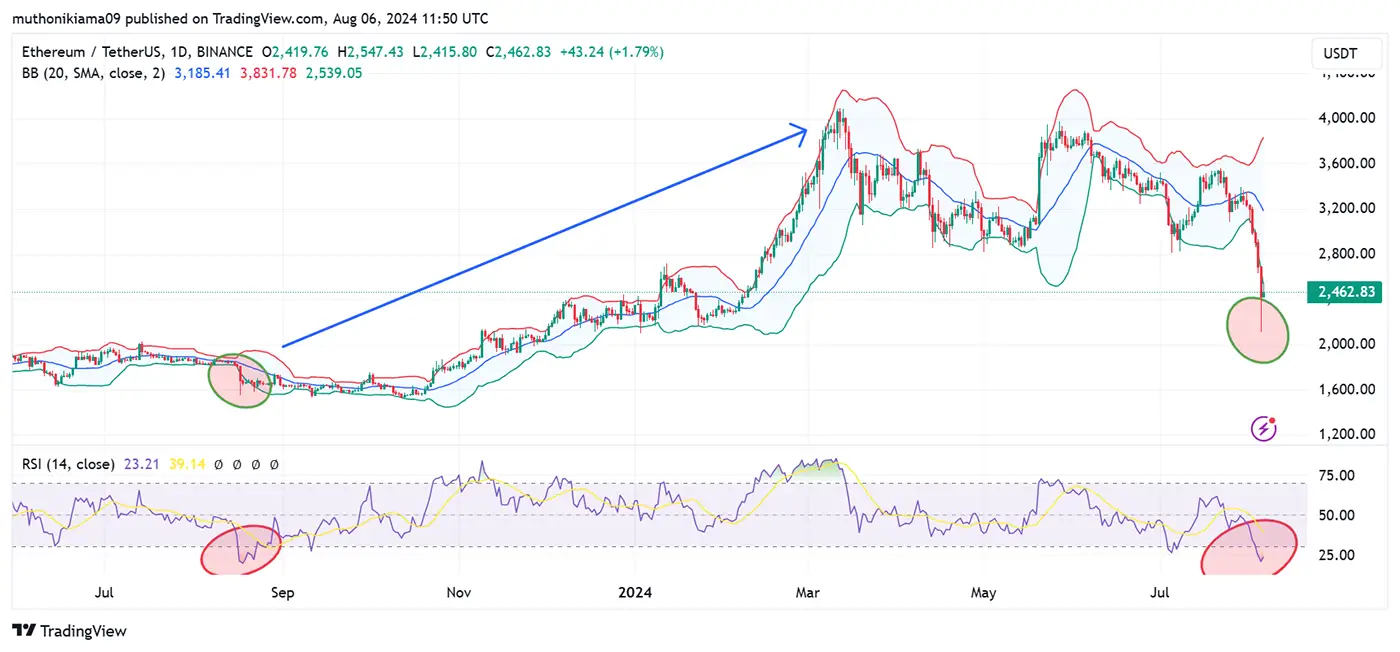
Ethereum price continued with a bearish divergence despite the recent price increase. ETH is yet to recover to its weekly high of around $3,300. Moreover, the market remains uncertain about the direction Ether price might take.
The Relative Strength Index (RSI) at 23 shows that ETH has been oversold at the current price, with the only expected trend being an upside. The RSI is currently at levels last seen in September 2023, a few months before ETH entered a bull market that saw its price soar past $4,000 within a few months.

If Ether price follows a similar pattern as it did last year, a bullish formation could be on the way to propel the price higher.
The widening of the Bollinger bands shows that the ETH price remains volatile. Short-term traders looking to scoop profits might trade the volatility hoping to make gains.
On the downside, ETH price has dropped from the 20-day Simple Moving Average (SMA) to the lower Bollinger band, indicating bearish momentum. Therefore, the price might continue to trade in a range before fair value is attained before a trend, either upwards or downwards, is confirmed.


