



Bitcoin demand just hit its weakest level of 2026. CryptoQuant puts apparent demand at about -255,000 BTC, far below its monthly average of about -172,000 BTC, and Bitcoin has slipped below $62,000 for the first time since July.
The number sounds technical. It is simple in practice: fewer buyers are stepping in than the new supply the market has to absorb, and the gap has now stretched to its widest point this year.

Key takeaways
- Apparent demand sits at -255,000 BTC, against a monthly average of about -172,000 BTC.
- Bitcoin fell below $62,000 and briefly under $61,500, its lowest price since July.
- US spot Bitcoin ETFs have lost $2.89 billion in November through November 18.
- About $528 million in liquidations hit in 24 hours as $62,000 gave way.
- Strategy’s 850,849 BTC stack now sits about $11 billion underwater.
What the -255,000 BTC number actually measures
Apparent demand compares how much Bitcoin the market absorbs with the new supply miners produce. When the reading is negative, buyers are not keeping up with supply, and coins pile up on the sell side.
- What the -255,000 BTC number actually measures
- The demand scoreboard: three gauges, one story
- How the price got here
- ETFs keep bleeding, and one fund carries most of it
- Strategy is now about $11 billion underwater
- What else is flashing red
- What has to change for buyers to return
- FAQs
- What is Bitcoin apparent demand?
- Why is Bitcoin demand negative right now?
- How low can Bitcoin go from here?
- What would bring buyers back to Bitcoin?
- The bottom line
CryptoQuant builds the gauge from changes in holdings and new issuance. It is a proxy, not a count of dollars flowing in or out, and analysts treat it as a trend signal rather than an exact ledger.
Why -255,000 is worse than it looks
The monthly average sits near -172,000 BTC. The latest reading runs about 83,000 BTC deeper than that average, or roughly 48 percent worse.
The gauge also dipped below -290,000 BTC before it recovered slightly to -255,000. That means the market already tested an even weaker level days earlier, and the bounce so far is small.
The demand scoreboard: three gauges, one story
CryptoQuant tracks demand through more than one lens. I pulled the three main readings into one table so the picture is easy to compare.

| Gauge | Reading | What it says |
|---|---|---|
| Apparent demand (30-day) | -255,000 BTC | Net buying is deeply negative, weakest of 2026 |
| Spot demand (30-day) | About -280,000 BTC | Cash buyers are pulling back, not just leveraged traders |
| Perpetual futures demand | About -82,000 BTC | Futures traders are also net sellers |
| Combined spot plus futures | Over -360,000 BTC | Both sides of the market are shrinking at once |
The split matters. A futures-only washout can end fast, because leveraged positions close and the pressure fades.
A spot-demand slump runs deeper, because it means the actual buyers of coins have gone quiet.
That quiet spot market is the same story behind the ETF flows. US sellers and ETF outflows drove the $62,000 plunge, and the on-chain data now confirms the buyers never came back.
How the price got here
Bitcoin closed at $80,443 as recently as November 5. Fifteen days later it trades near $62,000, a fall of about 23 percent.
The slide ran through several air pockets. A $2 billion liquidation wave over the weekend of November 14 to 15 pushed Bitcoin toward $62,100, its lowest since July 14.
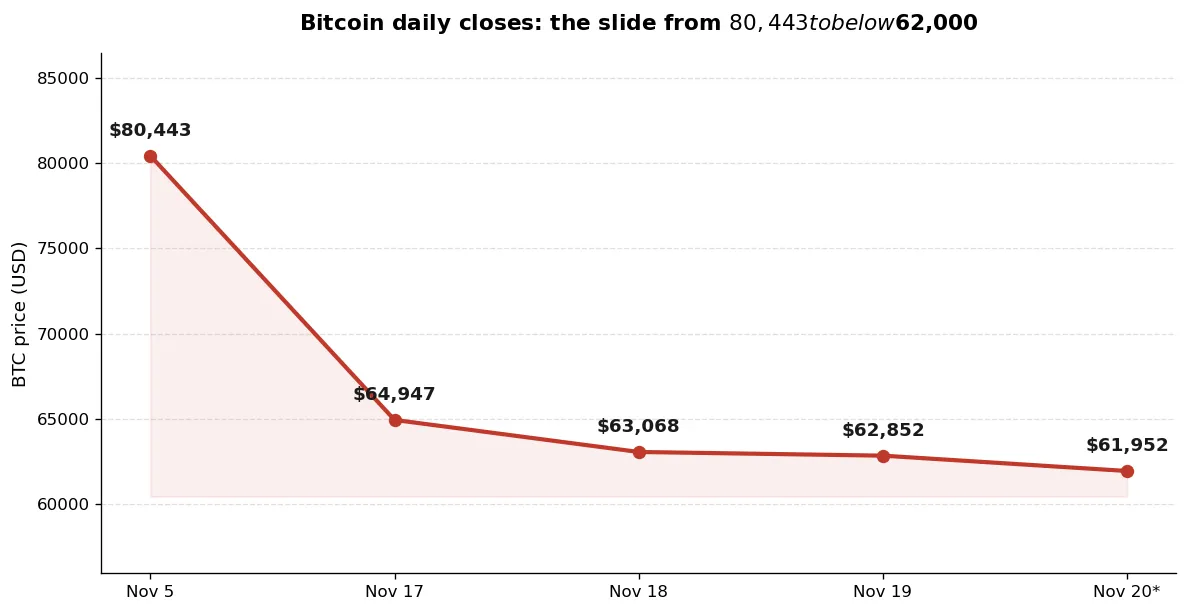
Bitcoin daily closes from November 5 to November 20. The November 20 point is the intraday price near 04:04 UTC.
Source: Finnhub, Binance BTC/USDT.
The $62,000 break
Bitcoin lost $62,000 late on November 19 and fell to $61,381 at 21:32 UTC, its first trip below $61,500 since July. CoinGlass counted $528 million in liquidations across crypto in the next 24 hours, including $169 million in Bitcoin alone, and more than 113,000 traders were liquidated.
About 80 percent of the liquidated value came from long positions. That tells us the damage hit traders betting on a bounce, not traders betting against the market.
This is the same pattern as the crash to a two-month low near $73,700 earlier in November, only deeper.
The levels traders now watch
The next big support sits near $57,700, the July low. Bitcoin bottomed at $57,742 on July 1, and a break below $62,000 puts that level back in play.
Above the price, the moving averages have turned into ceilings. The 365-day average sits near $75,900 and the 200-day average near $72,900, so any recovery has a long climb before it clears either one.
The longer-term picture is no kinder, as our look at the 200-week moving average shows.
ETFs keep bleeding, and one fund carries most of it
US spot Bitcoin ETFs have recorded $2.89 billion in net outflows through November 18, according to Farside Investors data. BlackRock’s IBIT accounts for about $2.40 billion of that total, or roughly 83 percent.
November 18 alone saw $306.5 million leave the funds, with IBIT losing $148.7 million that day. The biggest single day of the month was November 5, when $430.2 million walked out.
The outflow streak matters because ETFs were the main new source of demand for much of this cycle. When the largest fund bleeds every day, the market loses its steadiest buyer at the exact moment other buyers are stepping back.
The run now matches the longest streak of daily net outflows for US Bitcoin ETFs on record.
Strategy is now about $11 billion underwater
Strategy, the largest corporate holder of Bitcoin, added 485 coins in the week ending November 15 at an average of $68,887. Its stack now totals 850,849 BTC, bought for $64.20 billion at an average of $75,452 per coin.
At a price near $62,000, that stack is worth about $52.8 billion. The gap leaves Strategy with an unrealized loss of roughly $11 billion, and Bitcoin would need to rally about 18 percent just to reach the company’s breakeven.
The shares tell the same story. MSTR fell 4.6 percent on Thursday to $86.13, its sixth straight daily loss, and the stock is down about 37 percent from its $136.02 close on October 19.
Our earlier report on Strategy’s Bitcoin holdings shows how fast the cushion vanished.
Being underwater on paper does not force Strategy to sell anything. The company holds about $4.9 billion in US dollar reserves to cover preferred dividends, so the loss stays on paper unless management chooses to act.
What else is flashing red
Traders are sitting on unrealized losses of about 20 percent, the worst since July 1. One-day realized losses reached 25,800 BTC on November 17, the highest since July 13.
Stablecoin supply has shrunk by about $14.2 billion over the past month, according to Glassnode data cited by CryptoQuant. Less stablecoin supply usually means less dry powder waiting to buy the dip.
Miner transfers to exchanges jumped above 2,000 BTC, against a 30-day daily average of 127 BTC. Deposits do not always mean immediate sales, but the spike shows miners are moving coins toward the exits.
There is one counterweight. Anchorage Digital research head David Lawant says he sees very strong inflow interest for Bitcoin around $60,000, and Coinbase carried up to 60 percent of the early selling pressure, which points to US investors raising cash rather than a global rush for the exits.
What has to change for buyers to return
A bounce without demand is just a pause. For a real turn, the market needs at least two of these four shifts, and ideally all of them.
- Apparent demand climbs back toward its -172,000 BTC monthly average, then toward zero.
- ETF outflows slow or reverse, with IBIT posting its first inflow day in weeks.
- Bitcoin reclaims $65,000 and holds it, which would break the run of lower highs.
- Liquidations cool, so forced selling stops doing the market’s work for it.
Until then, rallies are likely to meet sellers. The $60,000 level is the line the market keeps defending, and more than $800 million in open put contracts sit at that strike, so a break below it could speed up the selling.
For the longer view, see our Bitcoin price prediction for 2026, which maps five year-end targets from a $74,000 floor to a $150,000 dream.
FAQs
What is Bitcoin apparent demand?
Apparent demand is a CryptoQuant gauge that compares how much Bitcoin the market absorbs with the new supply miners produce. A negative reading means buyers are not keeping up with supply.
Why is Bitcoin demand negative right now?
Spot buyers have pulled back, ETF investors are withdrawing money, and leveraged traders are being liquidated. All three forces hit at once, which pushed the reading to -255,000 BTC.
How low can Bitcoin go from here?
The next major support sits near $57,700, the July low. If $60,000 breaks, that level comes into play quickly, though nobody can say for sure where the bottom lands.
What would bring buyers back to Bitcoin?
Apparent demand needs to climb back toward its monthly average, ETF outflows need to slow or reverse, and Bitcoin needs to reclaim $65,000 and hold it.
The bottom line
Bitcoin demand has never been this weak in 2026, and the price shows it. The -255,000 BTC reading is not a prediction by itself, but it explains why every bounce so far has failed.
Watch the demand number, not just the price. When apparent demand starts climbing back toward its average, buyers are returning.
Until it does, caution beats courage.