



US spot bitcoin ETFs took in $2.39 billion in the week of September 21 to 25, 2026. That is their biggest weekly haul of the year. It also flipped total 2026 bitcoin etf inflows back into positive territory for the first time since spring.

Two clear drivers pushed the money in. The US Treasury doubled its bond buybacks in August, which nudged investors toward risk assets. At the same time, investors kept buying bitcoin as a hedge against rising US debt.
- What Exactly Is a Bitcoin ETF Inflow?
- How Big Was This Week, Really?
- Why Did Bitcoin ETF Inflows Surge in September 2026?
- Driver 1: Treasury buybacks opened the liquidity taps
- Driver 2: The debasement hedge and year-end positioning
- The Monday spark: a record day and a short squeeze
- Do Bitcoin ETF Inflows Directly Move the BTC Price?
- Why is Bitcoin flat (or down) when ETFs are seeing record inflows?
- Why do Treasury yields weigh on Bitcoin?
- Does a record inflow week mean Bitcoin will hit a new high?
- Which Bitcoin ETF Had the Biggest Inflows This Week?
- IBIT vs FBTC vs the rest: what a beginner should actually compare
- Ether ETFs are not sitting this out
- What Should You Do With This Information?
- Three rules for beginners when ETF headlines go wild
- Should you buy a Bitcoin ETF or real Bitcoin?
- Where to track ETF flows yourself
- Common Mistakes Beginners Make Reading ETF Flow Headlines
- Bitcoin ETF Inflows: Frequently Asked Questions
- How big is a $2.4 billion weekly Bitcoin ETF inflow?
- Why is Bitcoin down (or flat) when ETFs are seeing record inflows?
- Why do Treasury yields weigh on Bitcoin?
- Which Bitcoin ETF had the biggest inflows this week (IBIT vs FBTC)?
- Do Bitcoin ETF inflows directly affect the BTC price?
- What does it mean that 2026 ETF flows flipped positive?
- Why did Bitcoin ETF inflows surge in September 2026?
- What is a net inflow vs. outflow in a Bitcoin ETF?
- Does a record inflow week mean Bitcoin will hit a new high?
But there is a catch most headlines skip. Daily bitcoin etf inflows faded 87 percent from Monday to Friday. Bitcoin still finished the week near $84,000, far below its October 2025 high of $128,198.07.
This article answers the three questions that matter: why the money showed up, what it means for the bitcoin price, and how to read the next big ETF-flows headline without getting fooled by it.
Key Takeaways
- $2.39B flowed into US spot bitcoin ETFs in one week, the largest weekly total of 2026 and the fourth-largest since the January 2024 launch.
- Monday’s $998.95M was the 9th-largest single day ever, but flows fell to $134.5M by Friday, an 87% fade.
- Treasury bond buybacks and the debasement hedge were the two real drivers, not retail hype.
- Bitcoin hit $87,374 on September 21, then stalled near $84K: strong demand, but rising yields and overhead supply held the price back.
- For investors: record weeks are a demand signal, not a buy signal. Stick to your plan.
What Exactly Is a Bitcoin ETF Inflow?
A bitcoin ETF inflow is simple. It is cash flowing into the fund.
When investors buy shares of a spot bitcoin ETF during the day, money enters the fund. At the end of the day, the fund adds up all the buying and all the selling.

If more cash came in than went out, the result is a net inflow. If more cash left than entered, it is a net outflow.
The $2.39 billion figure is the net total across all US spot bitcoin ETFs for the week of September 21 to 25. That means new buying beat redemptions by $2.39 billion.
This matters because a spot bitcoin ETF is not like a stock or a bond fund. It holds real bitcoin to back its shares.
So when inflows rise, the fund has to buy actual bitcoin, usually the same day. When investors redeem shares, the reverse happens: cash leaves, and the fund sells bitcoin.
How a spot bitcoin ETF works, step by step
A spot bitcoin ETF is a fund whose shares trade on a stock exchange. Each share represents a slice of real bitcoin held by the fund. You can buy shares through a normal brokerage account, just like buying stock.
Behind the scenes, a group of large firms called authorized participants keeps the share price in line with the value of the bitcoin the fund holds. When demand for the ETF rises and more investors buy shares than sell them, these firms step in.
They deliver cash to the fund. The fund issues new shares. Then the cash is used to buy real bitcoin on the open market.
That is the key point beginners miss. As analyst coverage of these flows often notes, when that net number rises, the fund had to buy bitcoin the same day.
An inflow is not a prediction or a vote. It is a purchase.
How Big Was This Week, Really?
The record label is earned. The $2.39 billion week of September 21 to 25 is the fourth-largest weekly total since US spot bitcoin ETFs launched in January 2024.
It is the biggest week since the one ending October 10, 2025, which took in $2.71 billion. And it beats the previous 2026 weekly high of $1.92 billion from August.
For historical perspective, the post-election week of November 2024 still stands as the all-time record at $4.73 billion. So “best week of 2026” is real, but it is roughly half of the biggest week ever.
Consider what the number bought. At the week’s average price, $2.39 billion purchased roughly 28,423 bitcoin.
That is about nine times the 3,150 bitcoin miners produced that week. Against the complex’s roughly $108.4 billion in total assets, the week added about 2.2 percent in one stroke.
$2.39B
Weekly net inflows, Sep 21 to 25
9x
Weekly inflows vs newly mined BTC
~$108B
Total US spot ETF assets
The daily numbers tell a less rosy story
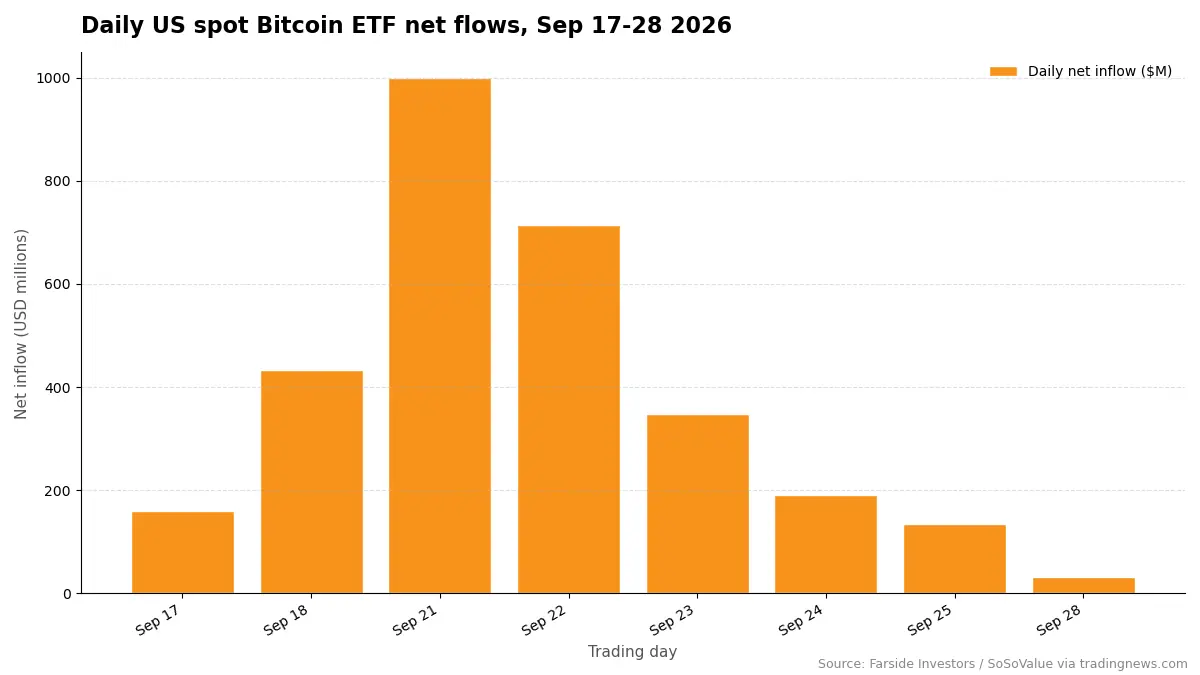
Here is the part most headlines buried. The $2.39 billion did not arrive evenly. It came as a burst that decayed.
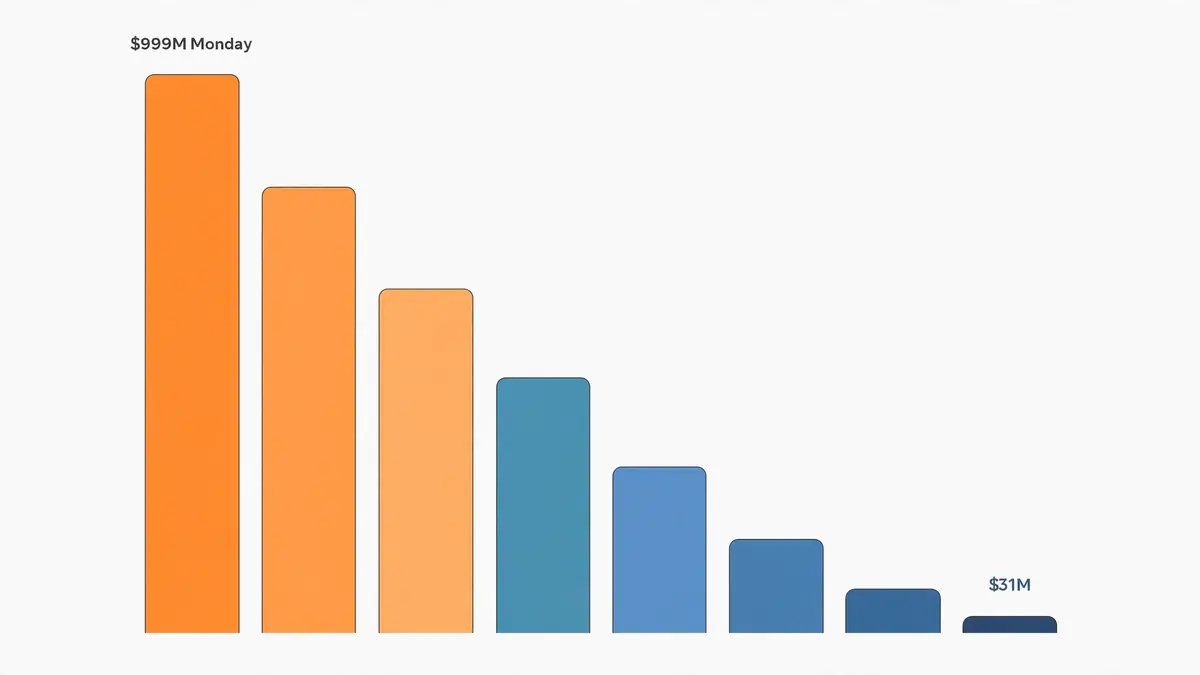
Monday, September 21 brought $998.95 million. Tuesday brought $714.75 million.
Then $346.98 million on Wednesday, $190.65 million on Thursday, and $134.47 million on Friday. The following Monday added just $31.07 million.
That is eight straight sessions of inflows, but the money was front-loaded. Every day of the record week came in smaller than the day before: an 87 percent fade from Monday’s peak to Friday.
Monday’s $998.95 million was the 9th-largest single-day inflow ever recorded and the largest since October 6, 2025. But the fade is the real story.
Tracking the daily numbers matters more than the weekly record, because one hot day does not equal lasting conviction.
What does it mean that 2026 ETF flows flipped positive?
The 2026 story for these funds started badly. Bitcoin fell to around $58,000 in June.
By mid-July, US spot bitcoin ETF flows for the year sat at roughly negative $5.8 billion. Money was leaving, not entering.
Then the turn began. On August 19, the Treasury announced it would double its bond buybacks. About $4.6 billion poured into bitcoin ETFs over the following five weeks.
By late September, year-to-date flows had clawed all the way back into positive territory. The total landed somewhere between about $320 million and $934 million depending on the tally, since SoSoValue and other trackers differ slightly.
Watch: Bitcoin ETFs turn positive for 2026 with $2.4 billion weekly inflow
This video cannot be embedded here, but you can watch it on YouTube: Watch on YouTube
The bigger picture matters too. Since the January 2024 launch, these ETFs have accumulated about $57.6 billion in net inflows. The complex now holds roughly $108.4 billion in assets.
That is about 6.43 percent of bitcoin’s total market value. The funds are no longer a sideshow. They are a permanent holder of the asset.
Why Did Bitcoin ETF Inflows Surge in September 2026?
Two real drivers pushed ETF demand to a record in September 2026. Neither is retail hype or a single viral moment. Both are macro forces that shifted how big money views risk.
Driver 1: Treasury buybacks opened the liquidity taps
On August 19, Treasury Secretary Scott Bessent announced that the US Treasury would double its bond buybacks to at least $4 billion per operation, running from September 9 to November 4. In plain English, the government said it would buy back its own long-term bonds at a faster pace.
Why does that matter for bitcoin? A bond buyback puts cash back into investors’ hands. It also lowers pressure on long-term borrowing costs.
When the government absorbs long-dated bonds, investors who held them need somewhere to put their money. Some of it flows toward riskier assets: stocks, and yes, bitcoin.
Bloomberg ETF analyst Eric Balchunas tied the surge directly to this policy. He described a “$4.6 billion tsunami of cash” flowing into bitcoin ETFs, per reporting by The Block.
NovaDius Wealth Management president Nate Geraci offered a second data point. He noted the funds “have now taken in $5.3 billion since the Treasury first announced the buybacks.” He also flagged that Monday’s $1 billion session was the 9th-largest ever.
The timing is hard to argue with. Roughly $4.6 billion entered bitcoin ETFs in the five weeks after the announcement. Over the same stretch, bitcoin rose about 35 percent, from near $64,100 to over $85,000.
Driver 2: The debasement hedge and year-end positioning
The second driver is older and simpler. The US national debt is enormous (the roughly $40 trillion framing now common in macro commentary).
Investors increasingly treat bitcoin as a hedge against currency debasement: the fear that governments will print and borrow their way out of debt, making each dollar worth less.
When Treasury buybacks signal looser financial conditions, that hedge logic gets louder. Money managers add hard assets that no government can print.
Notably, the buying came well below bitcoin’s all-time high. Investors were adding exposure without a new price record. That reads as positioning, not euphoria.
Year-end dynamics added a tailwind. The fourth quarter is historically bitcoin’s strongest period. Portfolio managers often rebuild risk positions into year-end.
The failed CLARITY Act cloture vote on September 15 and a Fed rate hike on September 16 created noise, but the underlying risk-on mood carried the week.
The Monday spark: a record day and a short squeeze
September 21 was the spark that lit the fuse. Bitcoin pushed toward $87,374, its highest price since January. A wave of short positions got liquidated as the price ripped higher.
Between roughly $648 million and $919 million in short positions were wiped out that day, depending on the reporting source.
A short squeeze works like this. Traders who bet on bitcoin falling are forced to buy it back when the price rises against them. Their forced buying pushes the price higher, which forces more shorts to buy, and the cycle feeds itself.
That one-day squeeze pulled Monday’s bitcoin etf inflows to $998.95 million. That was the week’s peak and the largest single session since October 6, 2025.
Do Bitcoin ETF Inflows Directly Move the BTC Price?
Yes, but. Bitcoin etf inflows mean real same-day spot buying through the creation mechanism, so they add genuine demand. A $998.95 million day is nearly $1 billion of real purchase orders hitting the market.
But bitcoin’s price is not set by ETF flows alone. It is set at the margin by every buyer and seller in the world, all at once.
ETF flows are one bid among many. To understand why the price did what it did this week, you have to look at the other side of the trade.
Why is Bitcoin flat (or down) when ETFs are seeing record inflows?
Think of it as a tug of war. On one side, ETF buyers pulled with $2.39 billion. On the other side, several groups were selling.
Long-term holders distributed near the $84,000 to $85,000 zone. That level has acted as overhead supply, per market analysis.
Miners sold the bitcoin they produce. Offshore sellers who never touch US ETFs added more supply.
If enough holders want to sell at $84,000, then even record ETF buying gets absorbed without the price breaking out. The money moved in, but it bought bitcoin from willing sellers rather than chasing the price higher.
That is why the coin sat near $84,000 by week’s end despite the record. This is a common beginner mistake: it treats one demand channel as the whole market.
ETF flows are a real signal of institutional appetite, but they do not override everyone else’s sell orders.
Why do Treasury yields weigh on Bitcoin?
The US 10-year Treasury yield sits above 5.2 percent, and that is a genuine headwind for bitcoin. The logic is straightforward.
When a government bond pays you more than 5 percent a year with essentially no risk, holding a volatile asset like bitcoin has to offer a better expected return to be worth it.
Bitcoin pays no yield, no earnings, and no dividends. It competes purely on price appreciation, so when the risk-free alternative pays well, bitcoin needs a stronger story to attract marginal buyers.
Higher yields also tighten financial conditions across the economy. Borrowing gets more expensive. Speculative positions get harder to fund.
Investors rotate toward the guaranteed return, which pressures risk assets broadly, including bitcoin.

Does a record inflow week mean Bitcoin will hit a new high?
No. Bitcoin’s all-time high is $128,198.07, set in October 2025. The price is roughly 34 percent below it.
A record inflow week is a demand signal, not a price guarantee. For our year-end price targets for Bitcoin, see the full Q4 outlook.
The headwinds are real. Daily flows faded 87 percent within the week.
The 10-year yield is above 5.2 percent. Long-term-holder supply near $84,000 to $85,000 keeps absorbing rallies.
Record weeks have often arrived near short-term tops, not at the start of clean breakouts. Treat the number as information about demand, not as a prediction.
Which Bitcoin ETF Had the Biggest Inflows This Week?
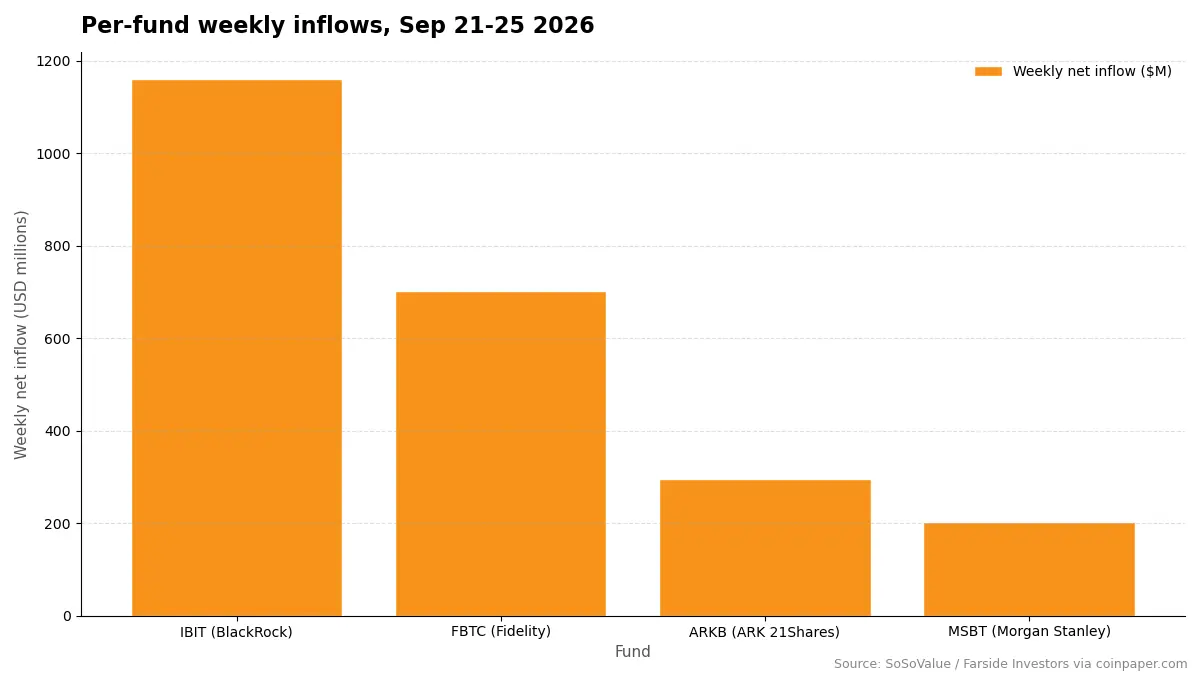
BlackRock’s IBIT dominated the week, as usual. It took in about $1.16 billion, roughly half of the $2.39 billion total.
It posted inflows on every single session. Monday alone brought IBIT $381.4 million.
Three funds accounted for more than 90 percent of the week’s flows. IBIT’s $67.31 billion in net assets makes it roughly 62 percent of the entire $108.4 billion complex.
That dominance is structural, not just weekly.
| Fund | Weekly inflow | Share of the complex | Notable |
|---|---|---|---|
| IBIT (BlackRock) | ~$1.16B | ~62% ($67.31B AUM) | Inflows every session; the default institutional vehicle |
| FBTC (Fidelity) | ~$701.7M | Large | Strong second place; Fidelity brand trust |
| ARKB (ARK 21Shares) | ~$294.7M | Smaller | Consistent mid-tier performer |
| MSBT (Morgan Stanley) | ~$203.3M | Smaller | Record week for the fund |
IBIT vs FBTC vs the rest: what a beginner should actually compare
Size is not the only thing that matters, but for ETFs it matters a lot. Bigger funds are usually cheaper to trade, with tighter spreads. They are also easier to enter and exit.
The three things a beginner should compare are simple. First, fees: the annual expense ratio, which eats into returns every year.
Second, liquidity: how tightly the share price tracks the fund’s net asset value. Third, the issuer’s credibility.
Before picking any fund, read a beginner’s guide to investing in Bitcoin. You should understand what you are actually buying before you buy it.
Ether ETFs are not sitting this out
Bitcoin was not the only beneficiary. US spot ether ETFs pulled in roughly $689.9 million for the week of September 21 to 25.
BlackRock’s ETHA led the ether funds with $326.2 million. Fidelity’s FETH followed with $174.1 million. Grayscale’s ETH Mini Trust added $100.3 million and ETHB added $47.5 million, per The Block, with the rest of the total spread across smaller funds.
The message is clear. The Treasury-buyback liquidity wave lifted crypto exposure broadly, not just bitcoin.
For a beginner weighing options, the choice usually comes down to three. A bitcoin ETF is simplest and stock-like.
An ether ETF carries more risk and more tech exposure. Buying bitcoin directly gives full control with full responsibility. Our how-to-buy walkthrough covers the direct route in detail.
What Should You Do With This Information?
Nothing in this news changes the core investing playbook. A record inflow week is context, not a command.
The honest takeaway is this: institutional demand for bitcoin is real and growing, but the price still answers to the whole market, not to one week’s flows.
Three rules for beginners when ETF headlines go wild
1. Do not chase green candles. Record inflow weeks often arrive at short-term tops.
Monday’s $998.95 million came the same day bitcoin hit $87,374, and the price faded from there. Buying because a headline excited you is the most reliable way to buy high.
2. Dollar-cost averaging beats timing flows. A fixed amount on a fixed schedule removes the guesswork.
You buy more when the price dips and less when it spikes, automatically. It is boring, and it works.
3. Flows lag; they do not predict. These flows describe money that already moved.
By the time you read the weekly record, the buying is done. Use flows to understand demand, not to time entries.
Our list of the top reasons investors consider buying now is a better framework for the decision than any single week.
Note: This article is informational, not financial advice. Bitcoin is volatile and you can lose money. Never invest more than you can afford to lose.
Should you buy a Bitcoin ETF or real Bitcoin?
Both have honest tradeoffs. An ETF wins on convenience.
You buy through your normal brokerage. It can sit in a tax-advantaged retirement account. You never worry about losing private keys.
The costs are real though. You pay an annual fee.
You cannot use the bitcoin on-chain. You do not truly hold it (not your keys, not your coins).
Buying real bitcoin gives you full ownership. You can spend, lend, or move it anywhere.
But self-custody means you are your own bank, and banks have security teams for a reason. If you go the direct route, read our Bitcoin security tips that actually stop scammers first.
Who suits what? Beginners who want exposure without new technology usually fit the ETF.
Hands-on investors who want full control and are willing to learn self-custody fit direct ownership. Either way, weigh the pros and cons of Bitcoin before committing money.
Where to track ETF flows yourself
You do not need to wait for headlines. Two free dashboards publish the data daily.
Farside Investors maintains a daily flow table for every US spot bitcoin ETF. SoSoValue offers live dashboards with charts.
Checking the daily numbers yourself is how you would have spotted the 87 percent fade inside this record week. For background on how these funds came to exist, see our explainer on what the ETF approval changed for investors.
Common Mistakes Beginners Make Reading ETF Flow Headlines
Beginners misread flow headlines the same four ways. Here is how to avoid each one:
- Mistake 1: Treating a weekly record as a guaranteed rally. Prices are set at the margin by all buyers and sellers. Record demand can be fully absorbed by record selling, which is exactly what happened near $84,000.
- Mistake 2: Ignoring the daily flows inside a record week. The headline said $2.39 billion. The daily tape said demand decayed every single day. The second story was more important.
- Mistake 3: Confusing gross buys with net flows. Inflows are new money in. The reported figure is net, meaning outflows were already subtracted. A fund can have huge gross buying and still post a small net number if redemptions were large.
- Mistake 4: Buying at the headline instead of sticking to a plan. Record weeks are the worst time to make emotional decisions. A dollar-cost-averaging plan beats a headline-triggered impulse every time.
Bitcoin ETF Inflows: Frequently Asked Questions
Here are the questions readers ask most about this record week, answered in one place:
How big is a $2.4 billion weekly Bitcoin ETF inflow?
It is the fourth-largest weekly total since US spot bitcoin ETFs launched in January 2024, and the largest since October 2025.
At the week’s average price, $2.39 billion bought roughly 28,423 bitcoin, about nine times the 3,150 bitcoin miners produced that same week. Against the complex’s roughly $108.4 billion in total assets, it added about 2.2 percent in a single week.
Why is Bitcoin down (or flat) when ETFs are seeing record inflows?
Because ETF buyers are only one side of the market. Long-term holders sold near the $84,000 to $85,000 zone. Miners sold their production.
Offshore sellers added supply.
If enough holders want to sell at a given price, even record buying gets absorbed without the price breaking out. Price is set by the balance of all buyers and sellers, not by one demand channel.
Why do Treasury yields weigh on Bitcoin?
A 10-year Treasury yield above 5.2 percent gives investors a high, nearly risk-free return. Bitcoin pays no yield, so holding it has to promise a better expected return to compete.
Higher yields also make borrowing more expensive and speculative positions harder to fund. That pressures risk assets broadly, including bitcoin.
Which Bitcoin ETF had the biggest inflows this week (IBIT vs FBTC)?
IBIT (BlackRock) led with about $1.16 billion, roughly half the weekly total. It posted inflows on every session. FBTC (Fidelity) came second with about $701.7 million.
ARKB took in roughly $294.7 million. Morgan Stanley’s MSBT had a record week with about $203.3 million.
Do Bitcoin ETF inflows directly affect the BTC price?
They add real same-day spot buying, so yes, they are genuine demand. But bitcoin ETF flows are one demand channel among many.
Price is set at the margin by the total balance of buyers and sellers. That is why a record inflow week can coincide with a flat price when other sellers step in.
What does it mean that 2026 ETF flows flipped positive?
It means that after a rough start to the year, institutional demand recovered strongly enough to erase the entire deficit. Flows had fallen to roughly negative $5.8 billion by mid-July.
Then about $4.6 billion entered over five weeks following the Treasury’s August bond-buyback announcement. That pushed the 2026 year-to-date total back into positive territory.
Why did Bitcoin ETF inflows surge in September 2026?
Two main drivers pushed bitcoin etf inflows to a September record. First, the US Treasury doubled its bond buybacks in August, putting cash back into investors’ hands and lifting risk assets.
Second, investors bought bitcoin as a hedge against rising US debt and currency debasement, alongside year-end positioning. A short squeeze on September 21, which pushed bitcoin to $87,374, provided the one-day spark.
What is a net inflow vs. outflow in a Bitcoin ETF?
Net inflow means more cash entered the fund than left it over the period. The fund buys bitcoin to match.
Net outflow means more cash left than entered. The fund sells bitcoin to meet redemptions.
The reported $2.39 billion is the net figure. Outflows were already subtracted.
Does a record inflow week mean Bitcoin will hit a new high?
No. Bitcoin’s all-time high of $128,198.07 (October 2025) sits about 34 percent above current prices. A record week is a demand signal, not a price guarantee.
Daily flows faded 87 percent within the week. Yields above 5.2 percent remain a headwind. Overhead supply near $84,000 to $85,000 keeps absorbing rallies.
The $2.39 billion week is a real milestone: the best of 2026, a full reversal of the year’s early outflows, and proof that institutional demand for bitcoin is alive.
But the details matter more than the headline. The money arrived as a fading burst, not a steady wave. The Treasury buybacks that powered it are a policy lever, not a permanent condition.
And bitcoin’s price still answers to the entire market: yields, sellers, and sentiment, not just ETF flows.
The smart move is to watch whether daily bitcoin etf inflows persist on trackers like Farside and SoSoValue, rather than celebrating one record week. If you are deciding what to do, start with the fundamentals: our step-by-step Bitcoin investing starter guide, the key advantages and risks of Bitcoin, and a plan you can stick to when the next headline hits.