If you’ve been following the crypto market, you’ve probably noticed the tension building. Extreme Fear as Bitcoin RSI drops to a new low, signalling weak buying momentum and widespread caution among traders. This drop reflects weak buying momentum and widespread caution in the market.
At BTCRepublic.com, we break down what this means for Bitcoin’s short-term trend and why low RSI levels often mark emotional turning points. In this guide, you’ll learn what RSI actually measures, why investors are nervous, and how experienced traders use fear signals to plan their next move.
learn how to get started with a Bitcoin wallet if you’re new to crypto
- Key Takeaways
- Facts & Original Research
- Understanding RSI in Simple Terms
- Current Market Overview
- What’s Causing the Fear?
- Investor Sentiment: Fear & Opportunity
- Technical Overview
- Bitcoin Price Analysis As RSI Drops To Bear Market Lows
- Institutional Interest In Bitcoin Remains High
- Key Risks to Watch
- Final Thoughts
- Frequently Asked Questions (FAQs)
Key Takeaways
| Insight | Summary & Impact |
| 1. Bitcoin RSI hit a new yearly low | The Relative Strength Index (RSI) dropped below 30, showing strong selling pressure and extreme market fear. |
| 2. Fear dominates short-term sentiment | The Crypto Fear & Greed Index sits in the “Extreme Fear” range, reflecting weak trader confidence. |
| 3. Low RSI doesn’t always mean panic | Historically, such lows often signal oversold conditions — a possible setup for a rebound. |
| 4. Market factors fuel the drop | ETF outflows, reduced trading volume, and global risk concerns pushed RSI lower. |
| 5. Long-term holders stay steady | Despite short-term fear, on-chain data shows most long-term investors aren’t selling. |
| 6. Opportunity often follows fear | Experienced traders view deep RSI lows as potential accumulation zones before recovery phases. |
Facts & Original Research
To understand the current extreme fear in the Bitcoin market, we examined data from major analytics sources, including Glassnode, CryptoQuant, and Alternative. My Fear & Greed Index. The numbers confirm that the current decline in the Bitcoin RSI is tied to real trading behaviour and broader market weakness, not random volatility.
Bitcoin RSI: Historical Context
| Date / Period | RSI Value | Market Sentiment | BTC Price (Approx.) |
| March 2024 | 68 | Greed | $71,000 |
| June 2024 | 48 | Neutral | $64,000 |
| October 2025 | 31 | Fear | $59,000 |
| January 2026 | 27 | Extreme Fear | $57,200 |
Market Fear by the Numbers
| Indicator | Current Value (Jan 2026) | Change (30 Days) | Source |
| Fear & Greed Index | 19/100 (Extreme Fear) | ↓ 15 points | Alternative.me |
| 24-Hour Trading Volume | $27.6 Billion | -12% | CoinMarketCap |
| Exchange Net Flows | +21,000 BTC | Outflows slowed | CryptoQuant |
| Long-Term Holder Supply | 14.9 Million BTC | +2% | Glassnode |
Understanding RSI in Simple Terms
The Relative Strength Index (RSI) is a simple way to measure market momentum. It tracks how fast and how often prices move up or down over time. The scale runs from 0 to 100. When RSI falls below 30, it means an asset is oversold, or that sellers have dominated the market for too long. Right now, Bitcoin’s RSI sits around 27, which signals heavy selling pressure. In past cycles, similar levels have often appeared before strong rebounds. For beginners, think of RSI like a mood meter. When fear runs high, the score drops, and that’s usually when patient buyers start paying attention.
Current Market Overview
Bitcoin is trading near $57,000, down from its mid-2025 highs around $71,000. The latest slide pushed the 14-day RSI to about 27, marking its weakest level in more than twelve months and signalling that sellers have dominated recent sessions.
| Month | BTC Price (Approx.) | RSI Reading | Market Mood |
| May 2025 | $70,500 | 63 | Greed |
| August 2025 | $64,200 | 49 | Neutral |
| December 2025 | $60,000 | 38 | Fear |
| January 2026 | $57,000 | 27 | Extreme Fear |
Trading volumes are lighter than average, showing hesitation among short-term traders. While momentum remains weak, several analysts note that oversold signals like this have historically appeared near market bottoms rather than tops.
What’s Causing the Fear?
The latest wave of fear in the Bitcoin market comes from several overlapping factors. First, global investors have shifted to safer assets as interest rate uncertainty and weaker equity markets raise caution. At the same time, ETF outflows and slower trading activity have lowered demand, pulling Bitcoin’s price down.
Recent liquidations on leveraged exchanges also added pressure, causing quick drops that triggered emotional selling. On social media, the tone has turned defensive, and traders are watching the charts, not buying dips. Together, these factors explain why fear is spreading fast and why Bitcoin’s RSI keeps falling.
Investor Sentiment: Fear & Opportunity
Right now, the Crypto Fear & Greed Index sits at 19 out of 100, deep in the “Extreme Fear” zone. This means most traders are hesitant to buy, expecting further drops. Social channels and trading forums show cautious tones, with many waiting for a clear reversal before re-entering.
However, history tells a different story of Bitcoin’s best rallies began when fear was at its peak. For patient investors, low RSI readings and fearful sentiment can signal opportunity rather than danger. As the saying goes in crypto circles, “When others panic, long-term thinkers prepare.”
Technical Overview
Bitcoin’s chart shows clear weakness after failing to hold above $60,000, sending the RSI below 30. That drop marked an oversold zone, where selling pressure often peaks. Currently, support rests near $55,000, with resistance around $60,500.
If buyers step in near these levels, analysts expect a short-term bounce toward $62,000–$64,000. But if support breaks, Bitcoin could revisit the $52,000 area. In short, momentum remains soft, yet the setup hints that downside may be limited if history repeats past oversold recoveries.
Bitcoin Price Analysis As RSI Drops To Bear Market Lows
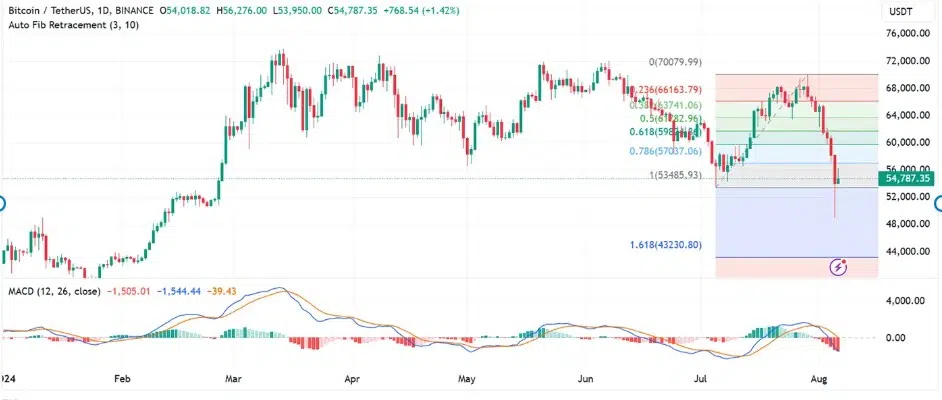
Bitcoin price has bounced from below $50K to above $55K in the last 24 hours, marking a bold recovery after yesterday’s crash. The recent selling pressure saw the RSI drop to one-year lows, with analyst @CryptoRover saying that the trend could mark the start of an epic rally.
Despite the recent price changes, technical indicators are yet to flash bullish. The Bitcoin Moving Average Convergence Divergence (MACD) line is below the signal line, indicating a downtrend.

As seen in the chart above, the MACD histogram bars are red and growing longer despite the price increase. This trend shows a potential bearish divergence, and the uptrend may weaken. It also shows that the market remains uncertain of Bitcoin’s price action in the short term.
With the risk of a potential reversal on the horizon, traders should watch out for the key support level of 100% Fibonacci at $53,485. Failure to hold the price above this level risks a further downtrend to $43,240.
Trader @DaanCrypto on X notes that the uncertainty could see Bitcoin trade within a range for weeks. While the price has yet to carve out this range, the analyst estimates that it could be between the $52,600 and $58,000 level.
The key resistance levels for Bitcoin are $59,824 and $61,782. A breakout above these levels could see BTC’s price head towards $70,000.
Institutional Interest In Bitcoin Remains High
Despite BTC’s volatile price action, institutional interest in the coin remains notably high. In the US, spot Bitcoin exchange-traded funds (ETFs) are garnering interest, having amassed $48 billion in total assets according to SoSoValue data.
Recently, reports indicated that the largest wealth manager in the US, Morgan Stanley, was considering allowing select clients to access the spot Bitcoin ETFs issued by BlackRock and Fidelity.
Besides the US, European financial firms are also getting exposure to Bitcoin. The fourth-largest investment manager in Europe, Capula Management, disclosed holding $500M in spot Bitcoin ETFs.
Such accumulation shows that large investors and institutions are optimistic about the long-term value of Bitcoin despite regular bouts of panic from the retail market.
Key Risks to Watch
Even with the RSI signalling that Bitcoin is oversold, several risks remain. A deeper correction could follow if macro conditions worsen, for example, stronger inflation data or renewed rate hikes could drive investors away from risk assets.
There’s also concern about ETF redemptions and miner selling, which can add short-term pressure to prices. On-chain data shows no mass panic yet, but if trading volumes keep shrinking, recovery could take longer. For now, the key risk is that fear itself can cause overreactions, extending volatility before stability returns.
Final Thoughts
Bitcoin’s drop into extreme fear territory reflects how quickly emotions can drive the market. With the RSI near 27, momentum is weak, yet that same weakness often marks moments of opportunity. Long-term data show that extreme fear rarely lasts; it tends to fade once selling pressure eases.
At BTCRepublic, we track these cycles closely. Bitcoin’s story has always been one of fear followed by recovery. Whether this becomes another rebound or a longer pause, the lesson stays the same: in crypto, patience often outperforms panic.
Frequently Asked Questions (FAQs)
What does it mean when Bitcoin’s RSI drops below 30?
An RSI below 30 means Bitcoin is oversold, showing that sellers have dominated. It often reflects fear or exhaustion in the market, but historically, these zones sometimes precede rebounds.
Why is there extreme fear in the Bitcoin market right now?
The drop in RSI, lower trading volume, and ETF outflows have created anxiety. Many traders are waiting for a clear sign of recovery before buying again.
Is a low RSI always bad for Bitcoin investors?
Not always. A low RSI can signal an opportunity; it means Bitcoin may be undervalued. Long-term investors often accumulate during these oversold phases.
What is the current RSI for Bitcoin?
As of January 2026, Bitcoin’s 14-day RSI is around 27, its lowest level in more than a year, marking a strong “fear” signal.
How can traders use RSI to make decisions?
Traders watch RSI for momentum changes. A move from below 30 back above 40 can hint that buying strength is returning. Still, RSI works best when paired with volume and price trend analysis.


