



Timmer’s $300K by 2029 bull market call has the full breakdown of his updated bull market outlook.
Fidelity’s director, Jurrien Timmer, says that Bitcoin could face one final pullback to around $56,500 after applying a model that he has been using to track BTC for years

The model, which he calls the “Bitcoin’s power law model”, tracks the BTC long-term price movements across several market cycles. The chart also shows Bitcoin’s performance against its historical average and the BTC-to-gold ratio using a 52-week Z-score.
The firm’s latest market analysis is based on Bitcoin’s historical price cycles and investor cost basis data. The company believes that the market cycles in the past show the same pattern with sharp pullbacks.
According to Fidelity’s chart, the Bitcoin price shows a 56% fall below its power law trendline. This fall places Bitcoin in the “accumulation zone.”
According to the firm, the same conditions appeared in the bear markets in 2015, 2018, and 2022, when Bitcoin traded well below its long-term.
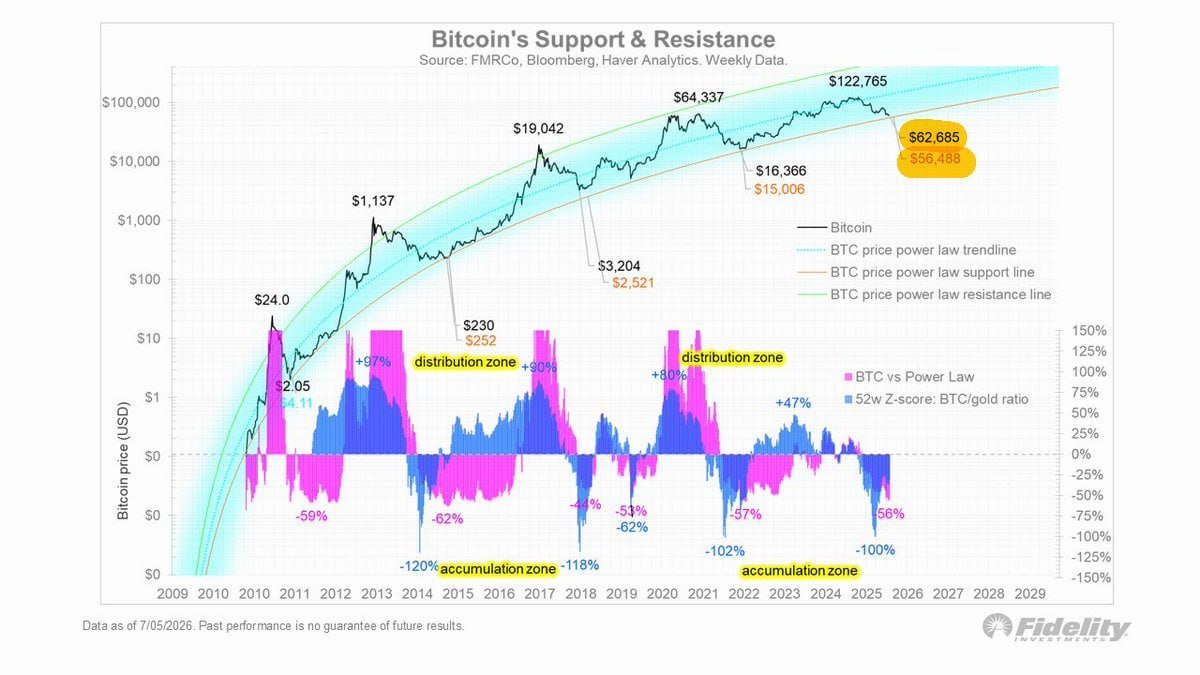
Fidelity’s data also shows that previous market tops formed inside “distribution zones,” where Bitcoin traded significantly above its power law trendline.

Those periods included gains of around 97% in 2013, 90% in 2017, and 80% in 2021 before major corrections followed. In contrast, accumulation zones have historically coincided with some of the best long-term buying opportunities.
Fidelity’s model currently places Bitcoin’s power law trendline near $63000, while long-term support stands around $56,488.
Although Bitcoin is trading below the trendline, it remains above the long-term support band, suggesting the broader structural uptrend has not yet been broken.
Bitcoin Price Faces Rejection, Bulls Prepare for a Downside to the Near Support
The BTCUSD pair is trading at $62764 after rebounding from the recent support zone. Price has been moving within a descending wedge pattern, signalling a potential breakout on the upside.
The support zone at $62700 still remains strong, as buyers also align with a previously identified demand zone. This level has helped prevent a deeper decline over the past several weeks. As long as Bitcoin holds above this support, the possibility of another attempt to break higher remains intact.
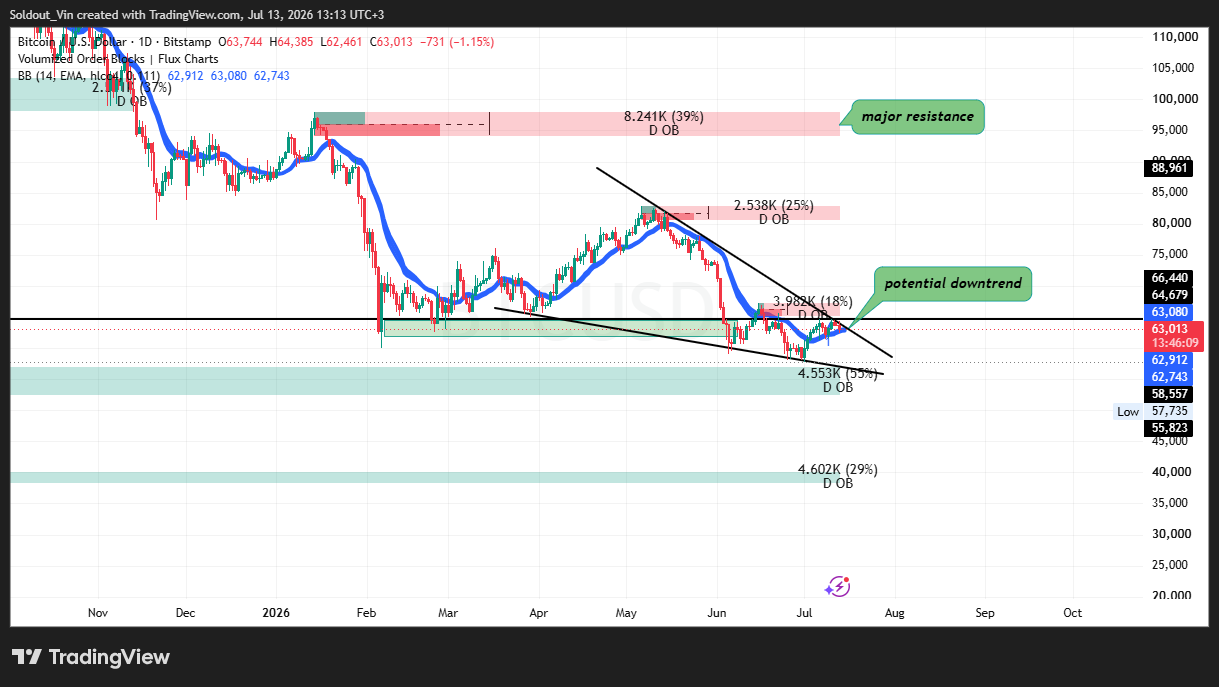
Bitcoin recently tested the upper boundary of the wedge but failed to push through, indicating that sellers are still active.
If the price is rejected again, the chart points to a potential move back toward the demand zone near $58,500-$56,700, where stronger buying interest could emerge.
On the upside, Bitcoin would need to break above the wedge resistance and reclaim the $66,000-$67,000 region to improve the short-term outlook.
A successful breakout could open the door to the next major supply zone around $80,000, while the strongest resistance remains between $95,000 and $98,000, where a large cluster of sell orders is visible.