



Chainlink trades near $12.45 on October 15, 2026, and our chainlink price prediction 2026 2030 puts LINK between $13 and $27 by the end of 2026 in the base and bull cases. Published 2030 forecasts span a huge range, from about $12 on the most bearish screens to $200 in Standard Chartered’s bank research.
That spread is the real story in this guide. We map bear, base and bull ranges year by year, we name the source behind each band, and we do the market cap math that a $200 price must pass.

Key takeaways
- LINK sits near $12.45, about 76% below its $52.88 all time high from May 2021.
- Our base case runs from $13 to $18 in 2026 and reaches $40 to $70 by 2030.
- Standard Chartered maps $13 in 2026, $41 in 2027, $82 in 2028, $133 in 2029 and $200 in 2030.
- The Chainlink Reserve held 6,047,498 LINK on September 26 and added 373,791 LINK in September alone.
- A $200 price needs a fully diluted value near $200 billion, about 16 times the level today.
Chainlink Price Today: Where LINK Stands in October 2026
Trackers priced LINK between $12.10 and $12.45 on October 15, with most quotes down 3% to 6% on the day. The drop came from a market wide risk off move after hot US inflation data, not from a Chainlink specific failure.
- Chainlink Price Today: Where LINK Stands in October 2026
- Our Chainlink Price Prediction 2026 2030: Bear, Base and Bull Ranges
- The Standard Chartered Path: $13, $41, $82, $133, $200
- The Market Cap Math Behind Each Target
- The Drivers That Decide Which Case Wins
- CCIP and the New CCIP 2.0
- Tokenization, Banks and Real World Assets
- Staking and the Chainlink Reserve
- ETF Talk and the Bitcoin Cycle
- Key Levels That Decide Each Case
- Risks That Can Break the Forecast
- Common Mistakes Readers Make With LINK Forecasts
- FAQs
- Conclusion
Bitcoin traded near $81,300 the same day, down about 3%, and altcoins took heavier losses than BTC. You can track that link in our Bitcoin price prediction for 2026, because LINK rarely rallies for long while Bitcoin falls.
The Levels That Matter Right Now
CoinMarketCap data shows a high volume rejection at $13.50 on October 12. Analysts put first resistance at $13.75, the 20 day average, and a recovery target zone at $16.50 to $19.50 above it.
Support sits close below the price. Traders watch $12.59, the 50 day average, then $12.39 and $11.98, and a head and shoulders breakdown below $13.56 points at those lower levels first.
Derivatives data shows calm, not panic. Open interest stood near $578 million after a 6.45% two day drop, and Santiment counted 681 whale transfers of $100,000 or more in one day, the highest count since November 19, 2025.

Our Chainlink Price Prediction 2026 2030: Bear, Base and Bull Ranges
No single model owns this forecast, so we built one table from the published ranges instead of picking one number. The table below blends screen model averages, scenario research from Godex and CryptoTimes, CoinStats ranges and the Standard Chartered path, and it labels what each band needs to happen.
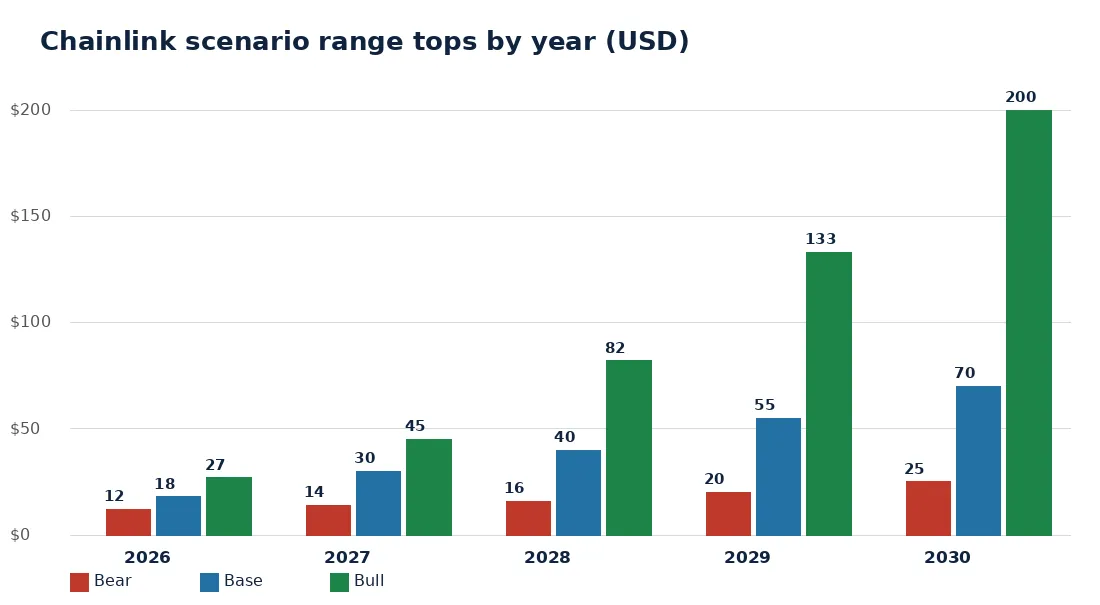
| Year | Bear case | Base case | Bull case | What the band needs |
|---|---|---|---|---|
| 2026 | $9 to $12 | $13 to $18 | $20 to $27 | LINK holds $12 support, or breaks $13.75 |
| 2027 | $8 to $14 | $18 to $30 | $35 to $45 | Bank pilots turn into paid production use |
| 2028 | $10 to $16 | $25 to $40 | $60 to $82 | Tokenized assets scale toward bank forecasts |
| 2029 | $11 to $20 | $32 to $55 | $85 to $133 | CCIP fees and Reserve buying compound |
| 2030 | $12 to $25 | $40 to $70 | $100 to $200 | Chainlink becomes core market plumbing, or stays one vendor among many |
Read the bear column with care. It does not predict a collapse, it prices a long consolidation where pilots stay pilots and Bitcoin gives LINK no cycle tailwind.
How We Built These Ranges
Screen models updated in early October mostly keep LINK averages in the teens to low $30s even out to 2030. We used those screens as the floor for the base case, because pure statistics ignore the fee growth that bank research prices in.
We used Standard Chartered as the top of the bull case, not as the base case. A few high outlier sites post far bigger numbers for 2026 alone, and we left those out because they name no driver that can deliver them.
Other large caps show the same pattern of wide bands. Our Ethereum price prediction 2026 2030 maps a similar split, and it shows why the Bitcoin cycle still sets the ceiling for every altcoin case.
The Standard Chartered Path: $13, $41, $82, $133, $200
Standard Chartered started coverage of Chainlink in August 2026, and analyst Geoff Kendrick set a $200 target for the end of 2030. His path runs $13 by the end of 2026, $41 in 2027, $82 in 2028 and $133 in 2029.
His logic rests on two big numbers. He expects tokenized assets on chain to reach about $4 trillion by the end of 2028, and he projects DeFi assets to grow about 37 times to $2.7 trillion by 2030.
Chainlink charges fees each time it delivers data or moves assets between chains. Kendrick expects those fees to rise about 25 times over the same period, and he maps the token price to that fee growth.
Treat this path as a bull case with a named author, not as a promise. LINK already trades near his $13 marker for 2026, and the later rungs need years of bank adoption to land on time.
The Market Cap Math Behind Each Target
Price targets mean little until you price the whole network. LINK has a hard max supply of 1 billion tokens, so each price maps to a clean fully diluted value that you can check in seconds.
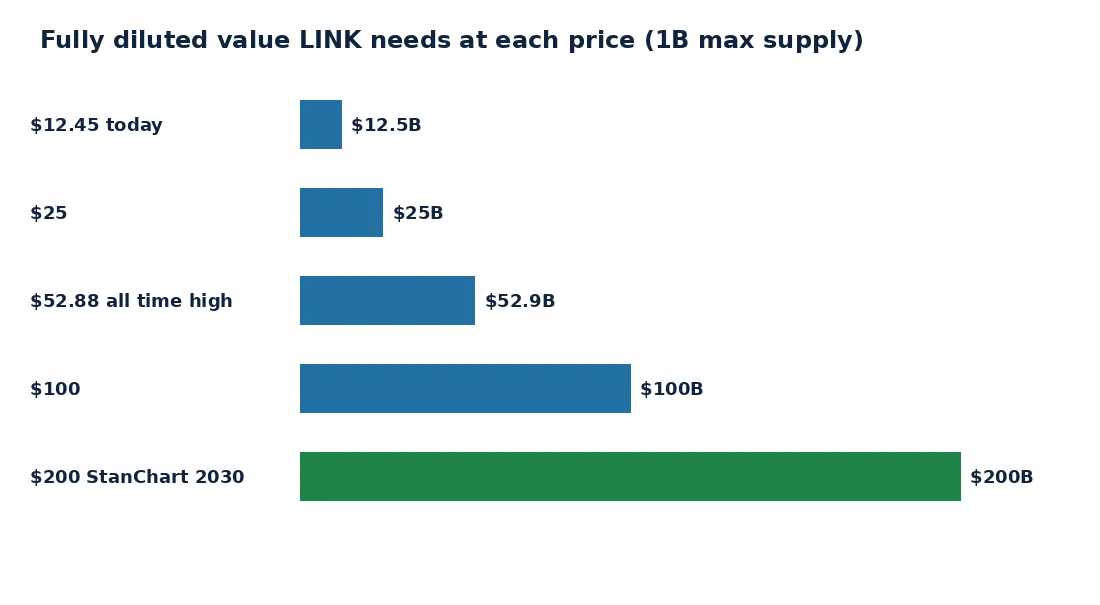
| LINK price | Fully diluted value | Multiple of today |
|---|---|---|
| $12.45 today | About $12.5 billion | 1 times |
| $25 | $25 billion | 2 times |
| $52.88 all time high | About $52.9 billion | About 4.2 times |
| $100 | $100 billion | 8 times |
| $200 | $200 billion | About 16 times |
This math sets an honest bar for the bull case. A $200 LINK in 2030 needs buyers to value the network near $200 billion, and that value must rest on real fees, not on hope alone.
Why This Check Beats a Headline Target
Headline targets hide the size of the ask. The table above shows the ask in dollars, and it lets you compare LINK with rivals that sit at a similar size today.
Cardano trades at a market cap close to Chainlink, near $9.4 billion to $9.7 billion for both networks in October reports. Our Cardano price prediction 2026 2030 runs the same math for ADA, and it shows how hard a 16 times jump is for any large cap.
The Drivers That Decide Which Case Wins
Four drivers decide whether LINK follows the base column or the bull column. Each driver has a live number behind it today, and each one can stall without warning.
CCIP and the New CCIP 2.0
Chainlink launched CCIP 2.0 on September 28, 2026, and the update adds Cross Chain Verifiers, plus KYC, AML and sanctions checks that banks demand. Chainlink says CCIP now supports more than $84 billion in cross chain token value, and more than $15 billion in token value is migrating to CCIP from older bridges.
New products keep adding routes to that bridge. CCIP Vault Adapters went live on October 8 for deposits from more than 80 chains, and Aave, Lombard and Maple adopted them at launch.
Usage already pays the network in a visible way. Chainlink’s own metrics put cumulative transaction value enabled near $34.18 trillion and total value secured near $56.6 billion, while DefiLlama attributes about $37.5 billion of oracle value to Chainlink across 534 protocols.
Tokenization, Banks and Real World Assets
Banks give Chainlink its strongest story and its slowest timeline. Swift, DTCC, Euroclear, JPMorgan, Mastercard, UBS, Fidelity and ANZ all use or test Chainlink tools, and the DTCC Collateral AppChain targets production in the fourth quarter of 2026.
Oracles sit under that whole market, because a tokenized bond still needs a trusted price from the real world. Chainlink proved that role again this year when Chainlink price feeds took over instant settlement for Polymarket markets, a live product that pays for data every day.
Watch the October 29 Link:NYC event for the next signal. Chainlink built that New York meeting for senior banking and capital markets leaders, and new production deals there would support the base case more than any price bounce.
Staking and the Chainlink Reserve
The Reserve gives LINK a direct link to revenue. Payment Abstraction converts enterprise payments and on chain fees into LINK, and the system deposits that LINK into a timelocked Chainlink Reserve that anyone can inspect.
The numbers show steady buying, not a one off headline. The Reserve held 6,047,498 LINK on September 26, about 0.81% of circulating supply, after it added 373,791 LINK during September, and Chainlink says it expects no withdrawals for several years.
Staking locks up supply beside the Reserve. The v0.2 community pool sits full at 40.875 million LINK against a 45 million cap, public staking opened again on October 5 subject to capacity, and stakers earn a variable rate near 4.32% to 4.75%.
ETF Talk and the Bitcoin Cycle
Traders keep speculating about a future spot LINK fund, but no approved product anchors this guide. Treat ETF talk as a sentiment driver only, and watch filings, not social posts, for any real change.
Bitcoin still sets the weather for LINK. Our long range Bitcoin price prediction 2030 shows the same split, where a strong BTC cycle lifts every large altcoin and a weak one caps them all.
Key Levels That Decide Each Case
Levels turn a forecast table into a plan you can follow. A daily close above $13.75 starts the base case, and a weekly close above $19.50 opens the road toward the bull column.
Failure looks just as clear on the chart. A daily close below $11.98 weakens the base case, and a drop under $9 would hand the year to the bear column.
The all time high adds one more line to watch. LINK must gain about 325% from $12.45 to reclaim $52.88, and our Litecoin price prediction 2026 2030 shows the same long climb back that many 2021 era coins still face.
Risks That Can Break the Forecast
Competition can take fees before Chainlink locks the market in. Rival oracle networks chase the same data business, and rival bridges chase the same cross chain volume that CCIP needs.
Execution can also slip in quiet ways. Bank pilots can stay pilots for years, a technical failure can shake trust fast, and token unlocks or weak staking demand can add sell pressure that charts alone miss.
Macro risk sits above all of it. Hot inflation pushed Bitcoin down about 3% and LINK down harder on October 15, and one data print can delay every case in the table by a full quarter.
Common Mistakes Readers Make With LINK Forecasts
The first mistake is to treat the $200 bank target as the expected price. It is the top of a bull path that needs $4 trillion in tokenized assets and about 25 times fee growth.
The second mistake is to skip the market cap math. A $100 or $200 call sounds small next to a $52.88 high, and the fully diluted table above shows the real size of each step.
The third mistake is to count pilots as revenue. Compare any new bank headline with the Reserve balance and CCIP volume, like readers do in our BNB price prediction 2026 2030, because fees leave a trail that press releases cannot fake.
FAQs
What is the Chainlink price prediction for 2030?
Our base case puts LINK at $40 to $70 by 2030, with a bear case at $12 to $25 and a bull case at $100 to $200. Standard Chartered holds the top of that bull range with its $200 target for the end of 2030.
Can Chainlink reach $200 by 2030?
Yes, it can, but the math sets a high bar. A $200 price needs a fully diluted value near $200 billion, about 16 times the level in October 2026, and it needs tokenized assets and Chainlink fees to grow at the pace Standard Chartered expects.
What will Chainlink be worth in 2026?
Our ranges put LINK at $9 to $12 in the bear case, $13 to $18 in the base case and $20 to $27 in the bull case for the rest of 2026. A daily close above $13.75 would support the base case first.
Will Chainlink reach its all time high again?
LINK must gain about 325% from near $12.45 to reclaim its $52.88 all time high from May 2021. Our base case reaches that zone only late in the decade, and the bull case passes it in 2028.
Is Chainlink a good buy in 2026?
Nobody can answer that for you, and this guide is not financial advice. LINK offers real bank adoption, a growing Reserve and the leading oracle network, but it also trades about 76% below its all time high and falls harder than Bitcoin in weak markets.
Conclusion
This chainlink price prediction 2026 2030 rests on one honest split. The base case grinds LINK toward $40 to $70 by 2030 on steady CCIP and oracle fees, and the bull case needs bank tokenization to scale fast enough to carry it toward $100 to $200.
Follow the proof, not the loudest target. Watch the Reserve balance, CCIP volume, the DTCC production launch and the $13.75 level, and let those four signals tell you which column of the table is winning.